The need to understand how open source software is built has never been greater. Today, 90% of IT leaders use open source for their organizations and value streams, and they need to quickly identify risks and opportunities to succeed and to reach the objectives they have. In this blog, we want to highlight some cases about the experiences of our customers on how Bitergia Analytics services works for them in their daily tasks and to reach these objectives.
In the first place, we put in context that Bitergia Analytics main focus is in analyze software development projects and its core platform is 100% open source. It collects data from 30+ different data sources related to collaborative and social software development. Also allows you to identify contributors and organizations for more detailed reporting and improved decision-making.
So, how do Bitergia Analytics services help our customers with the objectives?
Our customers use Bitergia Analytics services to understand software development projects, both internally and open source. Key insights they get include:
- Track growth, performance, progress, and diversity
- Get deep insights about community behavior
- Cross, combine, and visualize data
- Study performances for talent retention
- Analyze comments, forums, and chat

Bitergia is working with a variety of companies. Thus, let’s dive into three use cases.
We can see how Bitergia Analytics help customers in different ways to work better in their daily tasks, make better decisions, and reach their objectives.
Understanding the Developer Journey
Chef set a goal to increase the number of users who become contributors. To make that happen, Chef needed to identify the behavior of these transitioning people, encourage the actions that lead to such a transition, and help guide actions to empower their new contributors.
Chef asked Bitergia for a customized dashboard for their specific needs. For this case, Bitergia develops the DevRel Dashboard specifically for Chef and shows the activity in the user and developer communities across the different platforms used by both.
The idea was to see how people who transitioned to the contributor community behaved before when they were in the user community.
So, thanks to the solution and insights provided by Bitergia Analytics, Chef has been able to get deep insights into community behavior and make data-informed decisions about specific actions that helped grow their developer community.
Over time, Bitergia will provide numbers where they’re going to show whether Chef’s strategy is successful or whether a change in strategy will be needed.
Get deep insights about our work with Chef, read more here!
Building stronger Community relationships
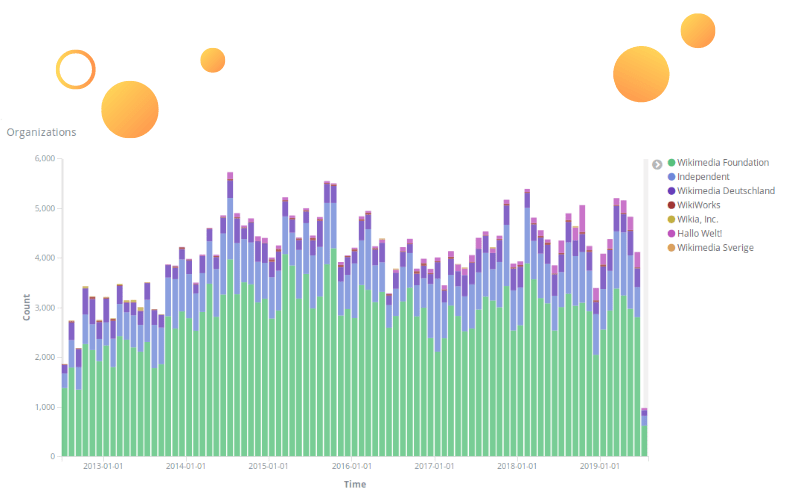
Bitergia provided a customized dashboard with metrics that answered Wikimedia Foundation’s questions. The Bitergia Analytics dashboard collected data from Wikimedia Foundation’s collaboration tools, specifically Gerrit, Git, and Mailing lists.
Wikimedia translated insights from Bitergia Analytics into business outcomes through retention statistics. The procedure is to look at the Bitergia dashboard to see how many developers have not contributed during the last six months. Consider these people as having left the community.
Then, Wikimedia sent surveys to these people, to understand the experiences and challenges of contributing. This helped Wikimedia learn why people leave the community and develop strategies for improving talent retention.
In addition to this. you can find more metrics visualization of Wikimedia Foundation, in the use case report!
Growing an Open Source Foundation
FINOS has several goals related to governance-by-contribution, including:
- Identify the level of activity of members.
- Reward the most active contributors.
- Determine voting rights in governance bodies based on level of contributions.
So, Bitergia created a customized dashboard with visualizations that address FINOS’s needs, about measure activity by individual community participants, activity by organization working for the same organization. Also, shows their collective activity and activity across data sources that provides insights into the types of contributions an individual or organization is focused on.
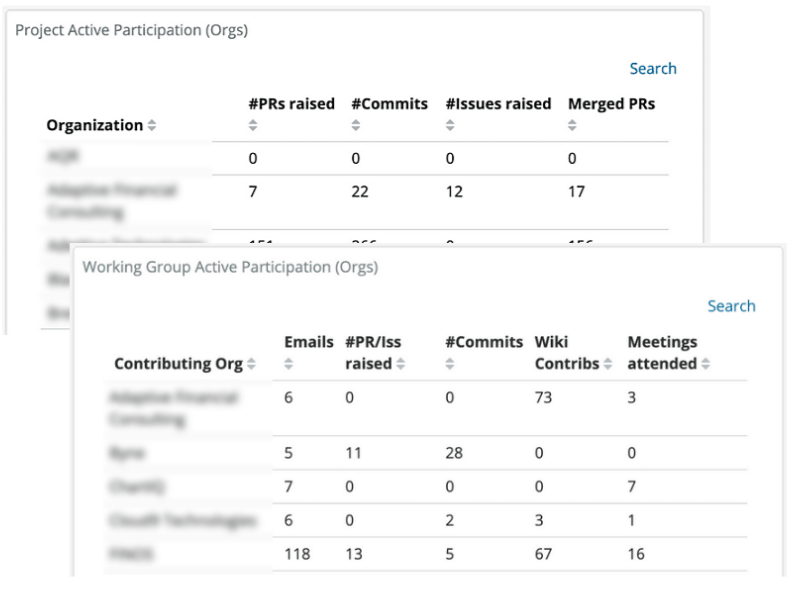
Therefore, explore more about the specific metrics used by FINOS in the Bitergia Analytics dashboard, check it here!
Additionally, Learn more about how Bitergia customers use our platform and services! You can find other use cases in our resources website area, take a look!
🦉The Owl’s advice: If you are interested in use Bitergia Analytics services to reach your objectives, request a demo with us now and we will be happy to help you with all your questions!
- Want to receive our Monthly Newsletter? ¡Subscribe Here! 📰
- Did you liked what you read? Give us a like or leave a comment! Also you can shared it on social media! 😀


