Modern software development pipelines are fractured with a lack of visibility across the entire product value-stream concealing process bottlenecks, constraints, and waste. Software development analytics can analyze value-streams within DevOps environments to provide full end-to-end visibility to the flow of work.
Gartner states:
Value-stream management is a growth area with more than half of organizations planning adoption or already at an implementation stage.
Garnter
However, its application sometimes gets complicated due to the lack of standard ways to process metrics, as well as common mistakes when implementing a flow analytics that provides real-time end-to-end visualization.
Manage value-streams with Value-Stream Mapping
A company’s main focus should not be on the flow of work through a process but on the flow of value. Being able to manage value-streams within the DevOps lifecycle, provides clear visibility of the progress of work through an organization and highlights bottlenecks and forms of waste.
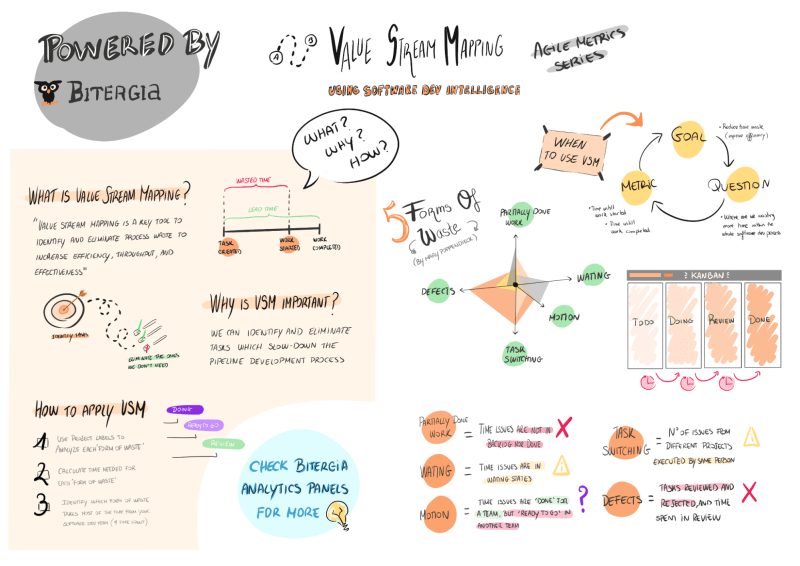
Value-Stream Mapping is a collaborative technique to visualize, analyze and improve the flow of work required to produce a product or service for a customer. Most companies uses it on identify the non-value added process (wasted time)
Thus, having a clear understanding about how a company’s value-stream mapping works, will improve the company’s value-stream management and thereby the overall decision making process.
When to use Value-Stream Mapping
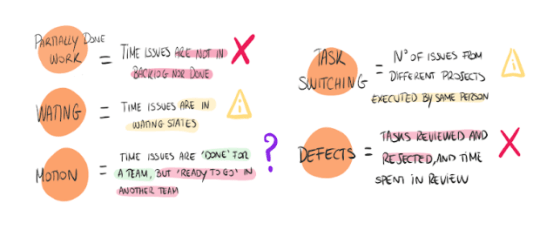
When looking at a company’s “project to product” flow (from customer request to customer value). There are several forms of waste (non-value added process) that can clog up such flow. The most common ones are:
- Partially done work maps to incomplete work
- Task switching maps to task switching
- Waste of motion maps to context switching (teams)
- Waste of waiting maps to delays
- Waste of defects maps to defects
Thus, analyzing the time and frequency from these forms of waste within the whole flow of value (from idea to production), will require to effectively define our value-stream mapping and building a comprehensive metrics strategy to do so.
Where to look for Value-Streams
From issue tracker systems, source code management, CI/CD tools, to monitoring tools. Value-Stream Mapping can cover the whole DevOps lifecycle.
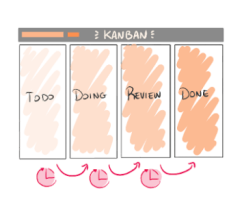
This means being able to measure the activity within Kanban boards (labels and issues) as well as project repositories (commits, issues, merge requests, and pull requests).
However, these activities usually happen within different platforms, which means taking time building your own analytics tooling that gathers data from multiple data sources, or finding a software development analytics provider able to analyze all these different data sources within a single platform like Bitergia Analytics.
How to analyze Value-Streams
Goal-Question-Metric approach for Value-Stream Mapping
The G-Q-M is an established goal-oriented approach: We will first focus on the business goals; Once the goals are settled, we can define common questions we can address to those goals; Finally, we can build specific metrics that answer those questions.
Reducing time waste and effort is the most common goal when DevOps practitioners seek to analyze value-streams and identify non-value added. Depending on the nature of the company, DevOps practitioners can pay attention to the relationships and processes between teams (identify internal non-value added processes) or to the relationships and processes between communities (identify external non-value added processes).
Identify internal non-value added within DevOps lifecycle
For this section we will be asking questions related to the activity of Kanban labels and issues.
| Questions | Metrics |
| How much effort is needed to deal with issues and pull requests coming from internal teams? | Trend of evolution of the number of issues assigned to a development stage (e.g., backlog, review, done) |
| Trend of the evolution of the average median time a label remains assigned to an issue | |
| How long does an issue remain on the Kanban column? | Trend of the evolution of the average/median time spent in a Kanban column |
| How long does it take for an issue to go through a set of Kanban columns? | Trend of the evolution of the average/median time spent in a set of Kanban columns |
| Are there any bottlenecks in the Kanban process? | Trend of the evolution of the average/median time spent in a Kanban column |
| Trend of the evolution of the average/median time spent in a set of Kanban columns | |
| Are blockers solved in a reasonable time? | Trend evolution of the average/median time spent in the Kanban columns used for blocked tasks |
| How long does an issue have to wait to be processed? | Trend evolution of the average/median time spent in the Kanban columns used as a backlog for tasks that need to be scheduled. |
Identify external non-value added within DevOps lifecycle
What happens when feature requests come from external sources? We are assuming that the team developing the product or project are the people defining the requirements and use cases. Thus, when we are working in collaborative environments, those “requirements” may come from “outside” the team, which requires a deep community understanding to identify non-value added processes. This is often the case when working with open source communities or InnerSource communities.
This means that to the questions stated above we can add community based questions, such as:
- How many people are asking for features or discussing features in the forums or communication channels?
- How many of those end in tickets/issues/user stories?
- How many of them are developed and delivered?
Closing thoughts
Using Value-Stream mapping to better manage a company’s value-streams within the product/project delivery process is something very specific, since it depends on the nature of the company itself (different procedures, departments, workflow, tools, etc). This means each company might accomplish a different metrics strategy.
Bitergia has an experienced team of software development experts that works on delivering insights on demand, coaching through metrics strategy, providing live metrics via dashboards, and generating reports. If you want to learn more about how Bitergia helped other companies to identify waste within their value-stream process, feel free to schedule a demo with us today!

