Last week we introduced Open Source Development resistance against COVID-19 discussion where we analyzed how a pandemic could impact Open Source development. This time, Bitergia runs the analysis on a second project: Kubernetes
Previous analysis catch up
We have been running Kubernetes development analysis on Cauldron.io. As mentioned in our previous analysis:
“We wanted to run something simple that anybody could run by themselves, even for their own projects or other projects that matter to them”
As a quick reminder: Kubernetes project is one of the three Open Source projects we decided to analyze as part of our Covid-19 analysis blog post collection:
- Linux kernel (Initial results already published in previous post)
- Kubernetes, the one we are describing in this post
- Hyperledger, to be published during following days
Note: the following dashboard is showing active commit authors per week, number of commits per week, moving average, active commit authors by timezone and active commit authors by email domain. To learn more, read our previous post
Analyzing Kubernetes project
Checking the code development activity in every git repository under Kubernetes organization in Github during the last months was initially slightly different from the Linux Kernel one:

Despite the expected Christmas holiday valley, since early January, activity dropped a bit but after that, it remained stable. We can start to see a second drop during the last days of February, but it’s soon to get into conclusions.
If we compare the shape of this curve from last year, we see that the little drop appearing during January-February is not something usual in 2019

Let’s zoom in to active commit authors for the same period of time, and let’s compare them:


What about Asia?
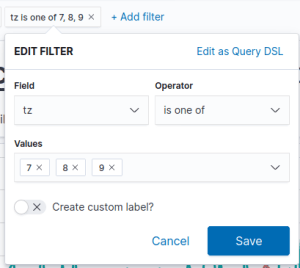
It’s been a while since COVID-19 affected the Asia area. For this reason, we decided to focus our attention there and see the evolution:
And here are the results:
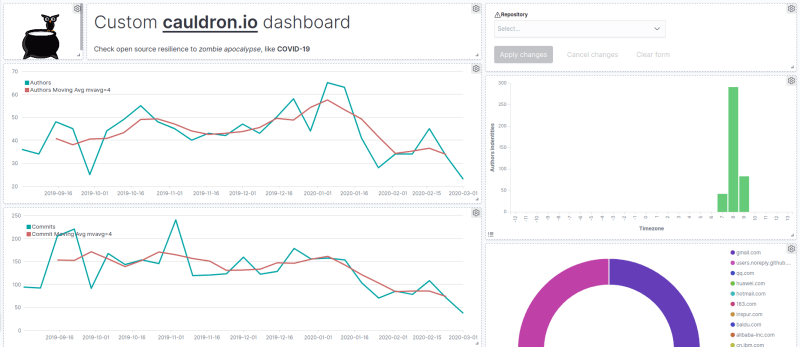
Here we can see something has slightly changed at commit author’s contribution: Christmas valley doesn’t seem to be an issue to stop contributing – although Chinese new year’s eve might have some impact- and even they started to increase activity during the first 2 weeks of January, right after that, activity decreases.
Bonus point:
Getting more into detail, by removing the most used non-company’s domains – i.e. gmail.com or hotmail.com-, this came out:
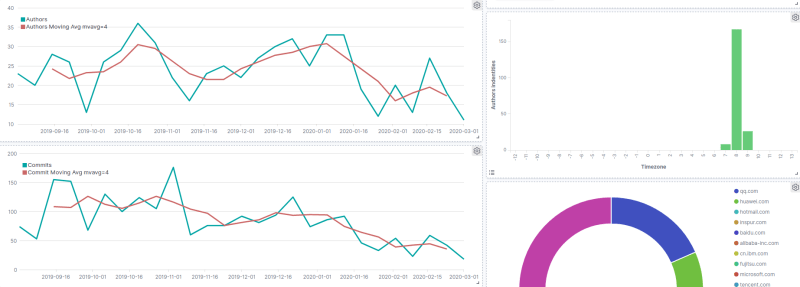
If we compare trends Worldwide and Asia time zones we can see a deeper activity decrease within Asia area

We found that the little peak right in the middle of this drop, it’s happening only in GTM 9+. If we delete this timezone from our filter, the valley becomes more visible
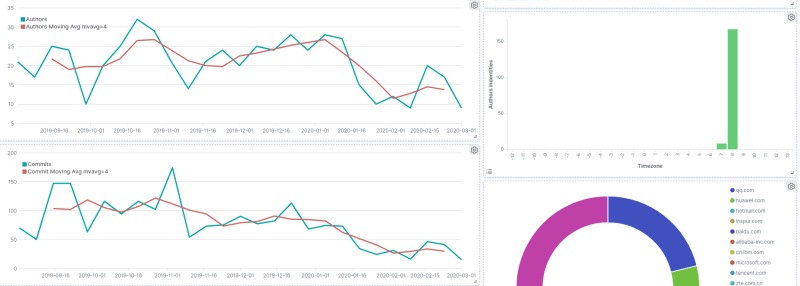
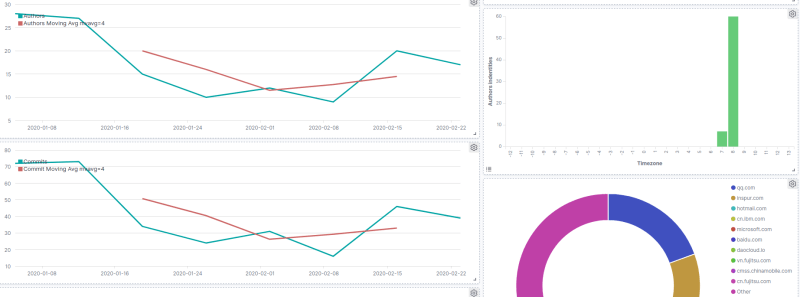
We can squeeze a bit and see how is this drop within the last days – end of february and first week of march- compared with previous year during the same time period:

Asia contributions in 2019 start to grow in February and remain like until April-Take into account Chinese year is in January- But surprise surprise, this pattern doesn’t repeat in 2020.


What about Europe?
Europe has been the second most affected continent so far. It would be interesting to see some data in the near future to see how quarantine days applied within certain European areas – e.g Italy or Spain- impact on Kubernetes git evolution. We will definitely take a look in a couple of days and let you know in our twitter account, so stay aware.
For now, let’s see at the data we have -collected until March 6th-
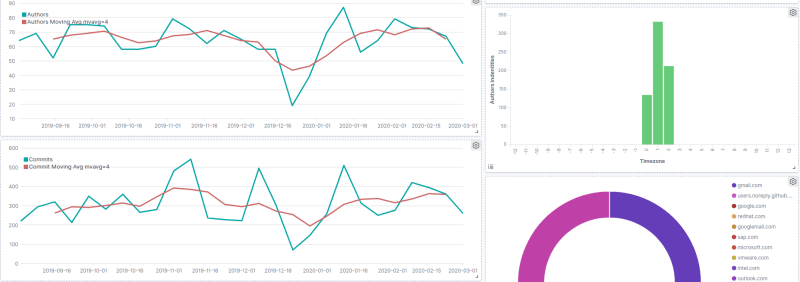
Christmas valley is clear and January drop is not very significant compared to Asias’ case, but it seems a continuous drop started to happen in February and it remains until March 6th
Bonus point:
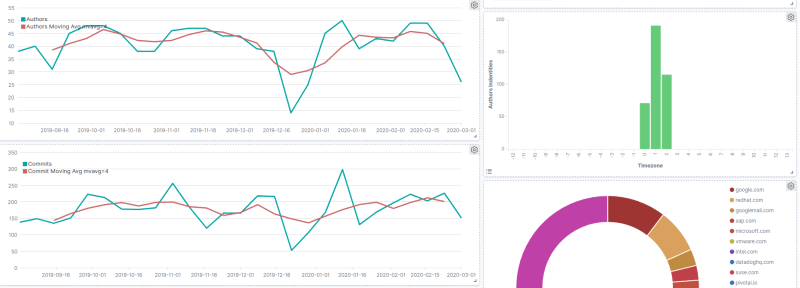
Looking at authors viz, we can see last drop is way more pronounced this time. Let’s see how this continues
Popular Kubernetes repos git activity
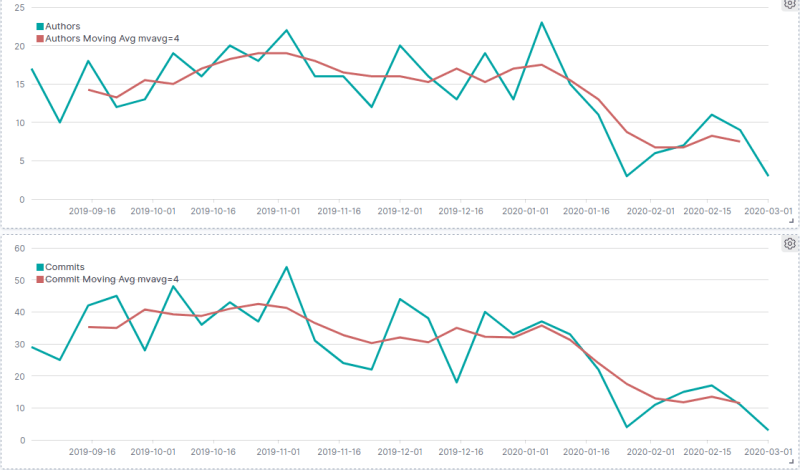
Kubernetes is a huge ecosystem, but actually its activity concentrates on specific projects. Is the most popular Kubernetes repository affected the same way as the entire Kubernetes? Cauldron.io can easily filter by repo to find this out
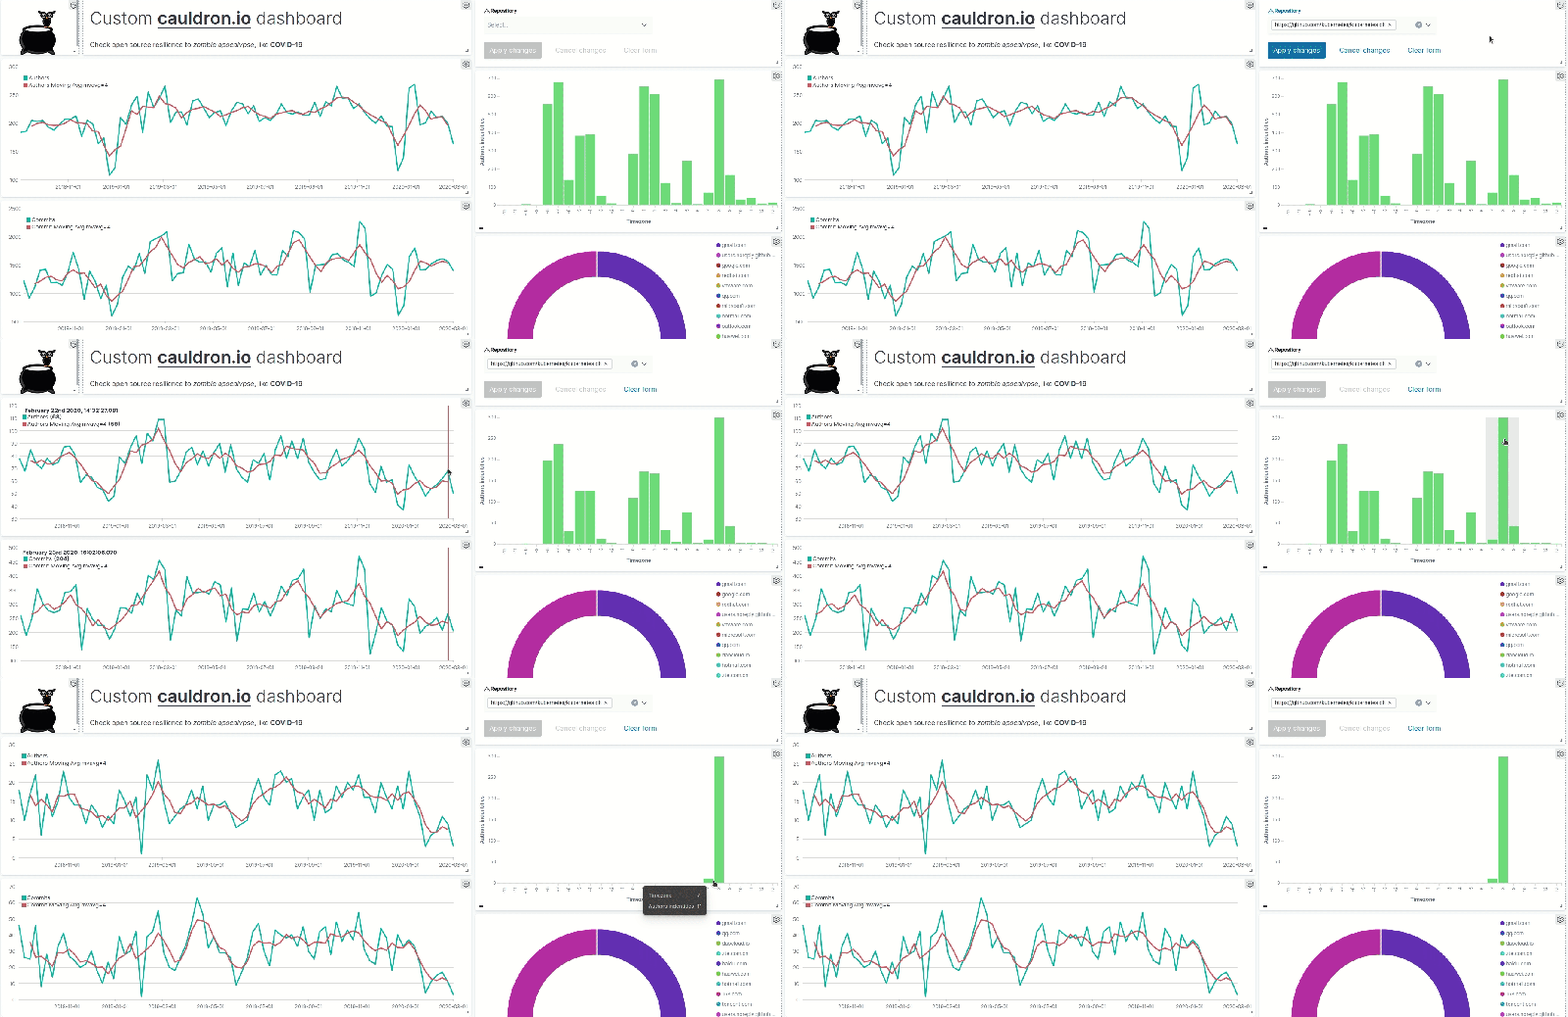
Once taking a look at the overall Kubernetes git repository, we see there are a lot of contributions from China’s time zone – GTM +8-. So we decide to inspect a little bit more. The huge drop from January to march 6th got us with no words.
Closing Thoughts
What we were trying to analyze here is the resistance of Open Source projects development to disruptive changes in their ecosystems. Something that we would like to check during the next months will be the resilience of these projects. If there has been a significant reduction, we want to see if there has been recovery in active people and their associated activity once these COVID-19 apocalypse is over.
Disclaimer: “Correlation does not imply causation”. We don’t have all the domain knowledge Kubernetes maintainers and community specialists might have. A relationship between COVID-19 and the project’s activity might be just coincidence.
This post is the second of the three analyses we have run (check the previous one about theLinux kernel development). Hyperledger analysis will be released shortly, meanwhile, free to run the same analysis in Cauldron for the projects that matter to you and share your results with comments to this post.


