Every other Thursday, the Common Metrics Working Group of CHAOSS meets to discuss about metrics that matter from a generic point of view for the health of open source projects.
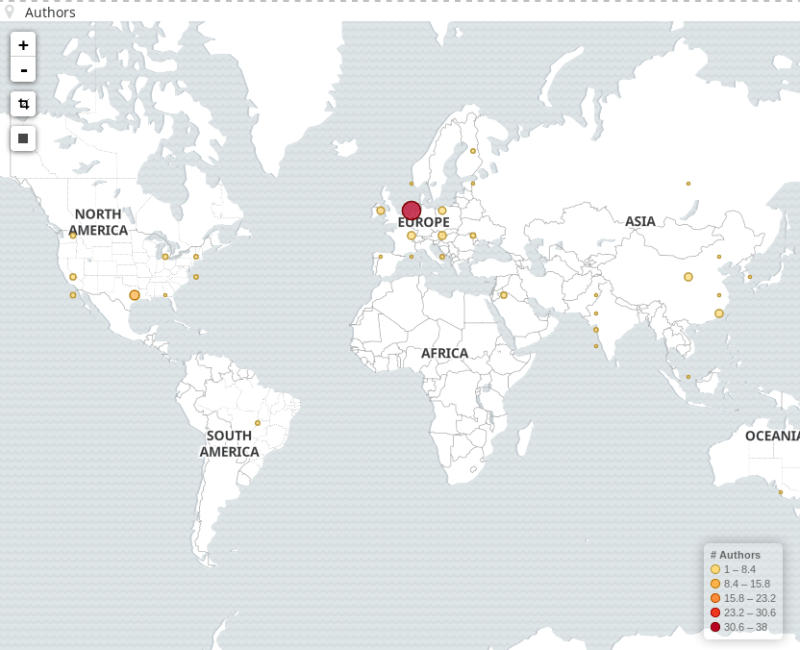
During the last meetings we had the opportunity to discuss about several topics such as responsiveness, releases, and geographical distribution. The latter is the topic of reference for this post. We discussed about one of the issues opened by agallo70.
And then I started to think about two main issues here: why this information might be important, and where I can find this information across the GrimoireLab toolchain or in any of the Bitergia dashboards.

I commented in the issue with my initial thoughts and I’d like to extend a bit more that analysis here in the blog.
Why is this analysis useful?
First, why is all of this useful at some point? Well, there are several pain points we could help with:
- Resources allocation to attract and retain community members. Given the distributed nature of open source, there will be areas in the world with more activity and those with no activity at all. Those with poor development activity may be part of specific policies to re-vitalize the community.
- Where to work with off line communities and start some technical meetups where people can learn about the technology.
- Are geographically far away developers or users being equally treated in the code review process. This is an interesting question as this may lead to potential discussions about how easy is to have face to face discussions, or at least discussions in similar timezones :).
These are just some examples of potential decisions we can make when having this type of data.
Where can I find this information?
And second, where is all of this information available? This can be found across several of the usual data sources that open source and InnerSource projects use. Some examples:
- Git and Mailing lists repositories: if this is correctly configured, we can extract the timezone of the commit and the email. As known instance, this is already part of GrimoireLab, examples at OPNFV project, ‘Commits by Time Zone’ widget.
Another example for mailing lists for the OPNFV project at the ‘Emails by Time Zone’ widget. - Country: this information is supported by GrimoireLab – SortingHat, and this might be extended to the indexes, so we may have pieces of information split by country if needed.
- And finally, there are cases where the data sources are providing geo-located information such as GitHub or Meetup. Examples of this might be some maps at cauldron.io (based on GrimoireLab) as the ARMMBED project in GitHub.
- IP: this is provided when talking about downloads and Apache logs. And this may give specific information, although biased if using VPNs.
From a more theoretical point of view, the following is an academic reference that might be useful for further discussion.
If you think these type of analysis are useful for you, GrimoireLab may be a good starting point. I’d recommend that you join the CHAOSS meetings. And if you want to have some more discussion, let us know! We at Bitergia can help with this type of analysis and metrics consultancy.


