To celebrate 25 years of Linux kernel development, we at Bitergia have produced the Linux development history dashboard. This dashboard visualizes the current Linux git repository from two points of view: the history of all commits (changes to the source code) up to now, and the history of all lines in the current version. The dashboard visualizes the main parameters about the development (the who, when and what) are visualized, and allows for drilling down in the data, for example finding the specific commits that lead to a specific part of the code.
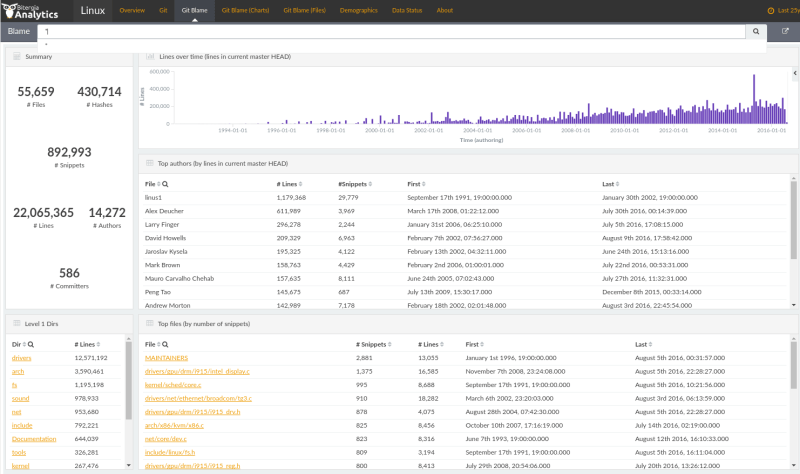
Do you want to learn about when the lines in the current kernel were authored? Who has participated in specific areas of the kernel? How many files have remain untouched for more than 10 years? Play with the dashboard and find your own interesting details!
The dashboard was produced using only free, open source software tools (among them, GrimoireLab, our tookit for software development analytics). If you want to learn more details, check the slides I intended to use for my presentation at LinuxCon, which unfortunately I couldn’t attend. Those provide some more insight about how it was produced, some examples about how it can be used, and some curiosities found by exploring it.
Playing with the dashboard is easy. Click almost anywhere, and you get a filter for that parameter. For example, if you click on the name of a developer, you get a filter which will produce only lines authored by that person. The filter is a green button, on the top right, which can be applied, negated, or deleted. Or combined with further filters, just by clicking on new parameters.
For facilitating the analysis of the history of the current Linux kernel, we have prepared three panels, based on visualizing the output of the “git blame” command:
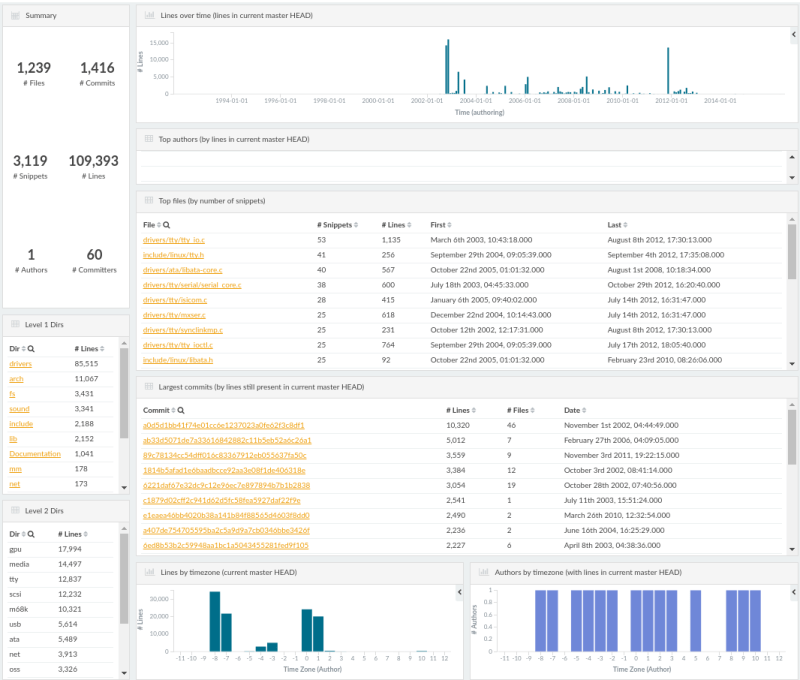
- The Git Blame basic panel, which shows mainly tables with different views of the lines in the current kernel (authors, files, commits, directories, file extensions, time zones), any of which can be used as a filter. Using it, for example, you can explore in which directories a certain developer has contributed, and with which specific pattern. For example, the next screenshot shows the results of this panel after filtering the activity of a single developer (just by clicking on his name in the authors table).
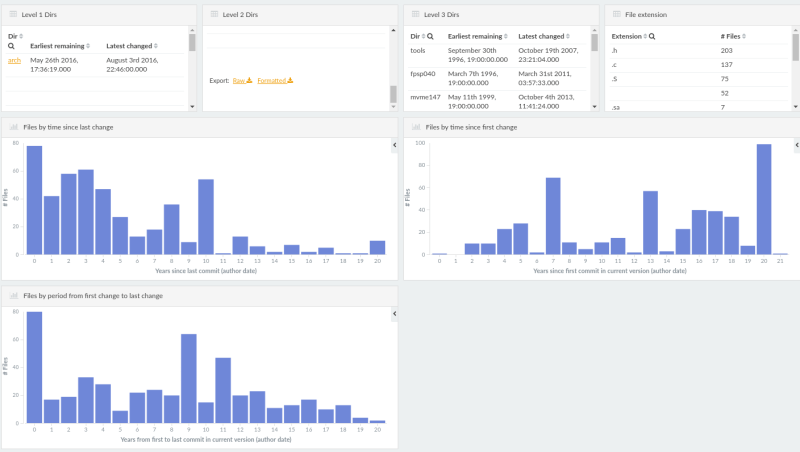
- Git Blame (Files). The basic Git Blame panel was oriented to lines, while this panel is oriented to files. Here you can find information about when files were last edited, when the first line in the current version of the kernel was authored, or for how long a file has been evolving. For example, the screenshot below shows the number of files according to certain time parameters (such as the number of years since the first line still remaining in the file, or since the last change to the file).
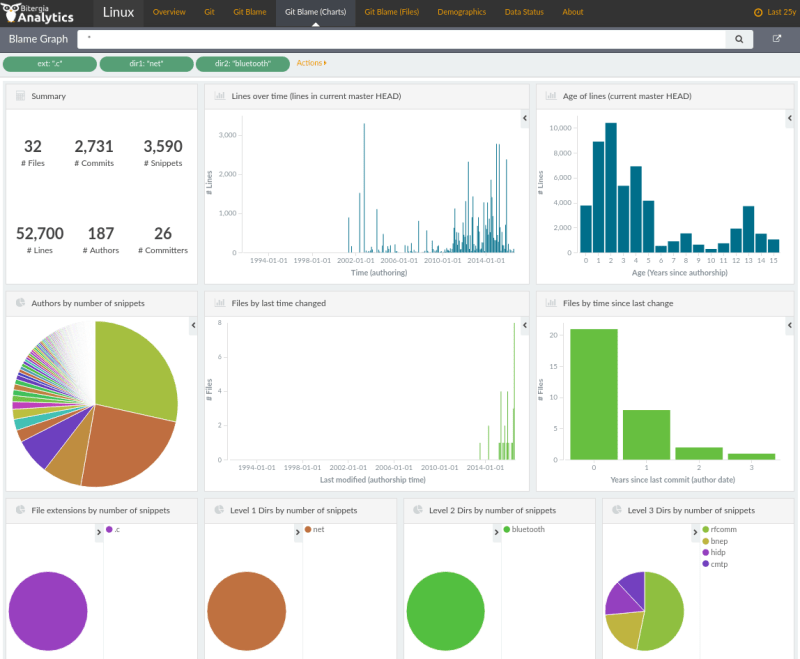
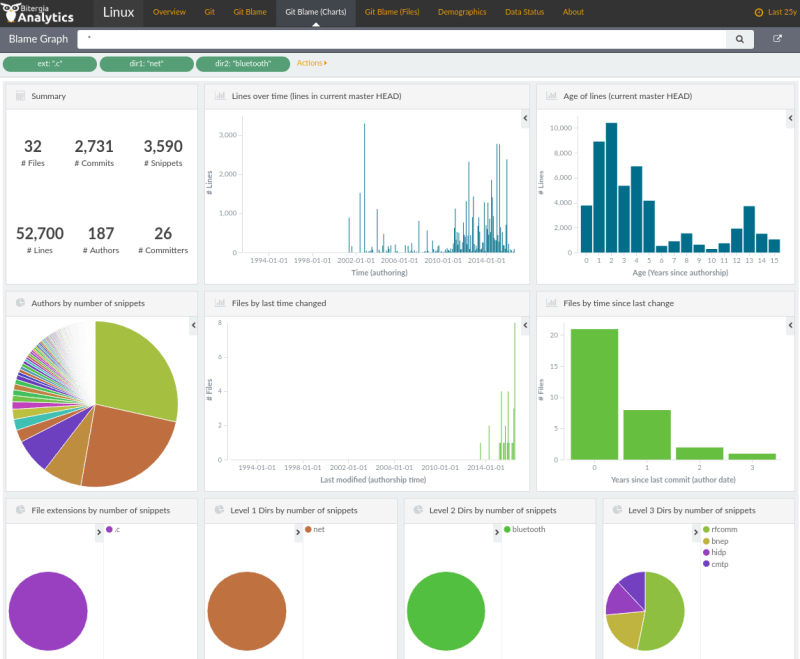
- Git Blame (Charts). Shows a summary of the information, but using charts instead of tables. The next screenshot shows, as an example, the result of filtering the files with extension “.c” in the directory net/bluetooth
Then, we provide also more classical panels with the commits history (visualizations of the “git log” output), which can be explored as well to learn about how the Linux kernel development has evolved over time.
This is a brief description of our present to anyone interested in how Linux was produced. We’re still fixing and improving the data, let us know if you find any bug, or know about how to improve it!

