Bitergia keeps growing as a software development analytics firm and nowadays, we are helping a wide variety of clients (project & community managers, engineering & development teams, HR managers, business analysts, etc.). Obviously, they’re not looking for the same goals in their projects, neither for the same metrics. So, how can Bitergia Analytics dashboards be customized for their specific needs?
During these years, we have been facing many people questions from the same community data: for instance, some of them might be more interested in community dynamics metrics while others will focus more on diversity and inclusion. Therefore, we need to adapt to those different needs and situations by offering customizable dashboards.
What do you get with Bitergia Analytics Dashboard?
Bitergia Analytics Dashboard is based in Kibana, with some extra features integrated or developed by Bitergia, like:
- Customized Search Guard plugin.
- Some extra visualizations like:
- A navigation menu to make easier reach some panels. Upcoming releases shall include a navigation menu manager.
Since, Bitergia Analytics dashboards are based in Kibana, most of its documentation is useful for any user, taking into account the following differences:
- Bitergia Analytics dashboards don’t include any Elastic X-Pack related software. We try to keep our product as free, open source code as possible, and aligned with GrimoireLab development.
- Some features might be available or not, depending on your user profile (anonymous, admin, etc.).
- While Elastic calls dashboard to each set of widgets/visualizations rendered in a canvas, we will call them panels.
By default, any customer shall get a set of panels based on GrimoireLab Sigils, and some of them have been added during last platform upgrade.
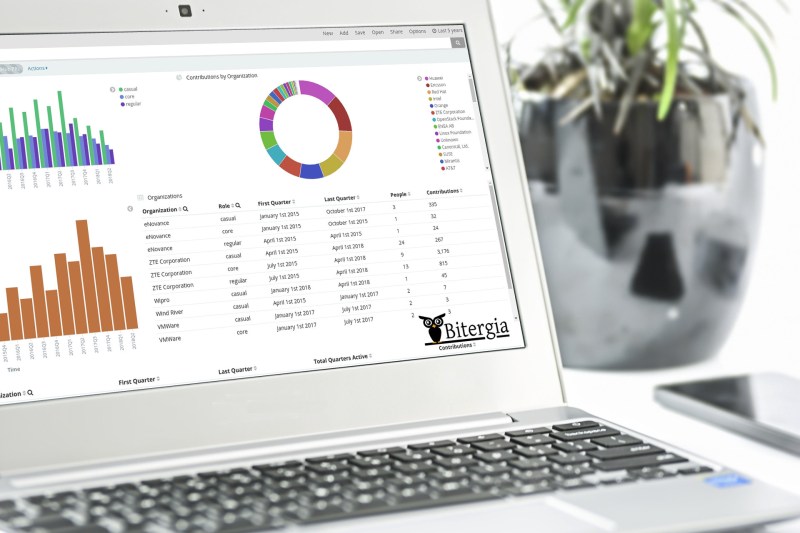
These panels are the ones shown by default in the public dashboard usually for community transparency. Anyone is able to navigate through the different items, drill-down, filter, query, etc. You could even re-arrange widgets or change its size, as shown in the following video:
However, in today’s post we will focus more on how customers can make their own dashboards. Let’s see how it works.
Login into Bitergia Analytics Dashboard
Up to date, Bitergia analytics dashboard also have provided two ways to visualize your dashboard: one editable version and a read-only mode (the public dashboard). To access to the editable version, users need to know about the whatever.biterg.io/edit URL.
With the recent upgrades, Bitergia Dashboards have now a login button and a login screen based on customized Search Guard plugin. It shall allow to produce different access roles in the future, so scenarios such as having both public and private data at the same time shall be possible.
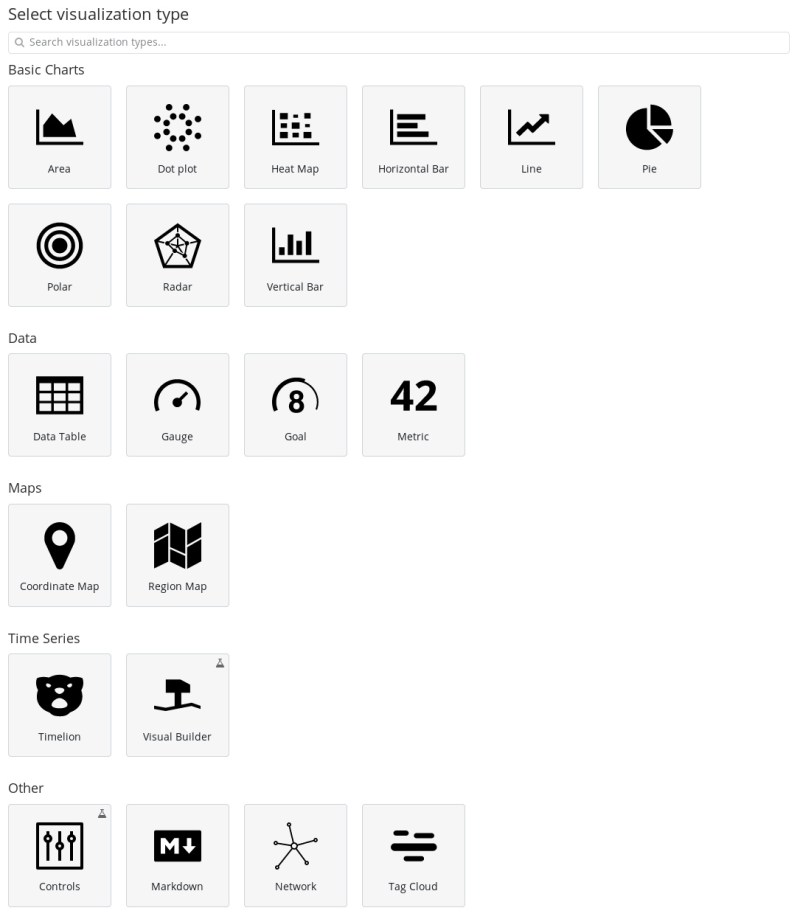
Once logged in, the user is able to modify existing panels or create new ones, based on existing widgets or even building new ones based on available visualizations:

Most of them are based in Kibana visualizations, with the custom ones mentioned before: Network Analysis, Search-Tables, DotPlot, and Radar.
Users creating new panels are requested to save them with an special name (C__(] | [])), to avoid losing them during platform upgrades. But, what if you want to create a panel and share it with the rest of Bitergia Analytics users or the GrimoireLab community to allow them to use it in their own instances? Yes, you can!
Sharing Bitergia Analytics / GrimoireLab panels with other users
One of the key features of Kibana is that you can export stored items, like dashboards/panels, visualizations, etc. But, when we started to integrate Kibana in GrimoireLab, if you exported a panel, you’ll only get a basic JSON file describing it, but not the visualizations and searches included in it. To solve that issue we created KiDash.
It seems Elastic has finally integrated an API to do the same job!
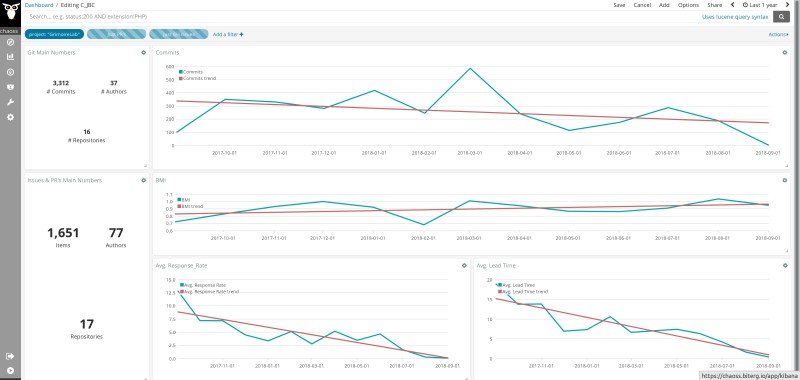
Based on these features, people have started to create their own panels and shared with the rest of the community. One of the most remarkable examples are the panels done by Ben Lloyd Pearson and that he presented during latest CHAOSSCon (Slides in PDF format):
Even myself have started to collect some use cases, what about you?

Customizing Bitergia Analytics Dashboards for you
Since all these features are already available to you, feel free to use them. And remember that Bitergia can help you to build those custom panels aligned with your goals or the questions you might have about your development processes.
During the following weeks Bitergians will be attending to lots of open source conferences around USA and Europe. We will keep you updated with our activity on our social media, so go ahead and follow us on Twitter and LinkedIn to know more!!


