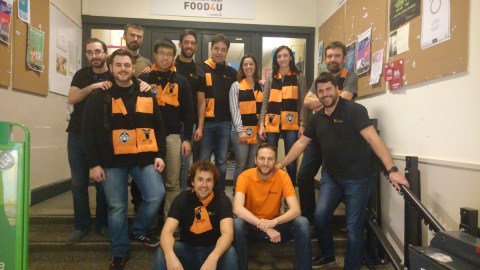
As we were telling you a few weeks ago, we were joining FOSDEM, not only as attendees but as speakers.
We would like to share our experience, giving you details about our talks…
1. How Rust in being developed.
Jesús González-Barahona gave a talk about how Mozilla Rust is developed by the community.
He presented the dashboard we have produced for Mozilla, and showed how to use it to learn about the details of Rust development processes and community. He also presented some interesting data obtained from it:
- Affiliation. 20% of the contributions are from Mozilla community, but there are people from other communities, such as Microsoft, Red Hat or Mongo, not only developing Rust but contributing answering question on Stack Overflow. The most of the contributions provides from non affiliated people.
- Git gives metrics about the commits made for last two years and shows how Mozilla community did more than the 24% of them. For that case, non affiliated people provided only the 60%. The dashboard shows clearly how the number of commits has going down in the last October, having the lowest point currently.
- Stack Overflow gives data about questions and answers submitted by users and community. The dashboard shows not only the activity rates, but the most involved people and the reputation for each. That is a good hint about the adoption of the product.
- The dashboard shows also the analysis of the mail threats, giving the user a trust score.
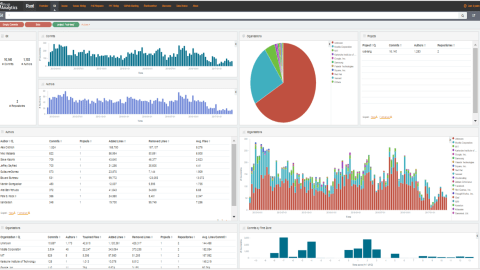
Jesús gave some details about how to filter, drill down and compare. Here you have the dashboard to have your own conclusions and the recording of the session.
2. How LibreOffice is being developed
Jesús was explaining LibreOffice Grimoire Lab dashboard deployed by The Document Foundation with some Bitergia support.
For this project, they have used tree data sources: Git, Gerrit and Bugzilla.
We can see easy and quickly some data about the project such as commits, authors, changesets and repositories.
You are able to notice just with a quick overview that:
- There is a high peak of commits in 2015.
- You can see that, although the number of authors has been regular over the time, currently it’s lower than ever.
- Despite of that, the activity around the changesets is higher than ever in 2017.
About the authority, you can check the affiliation of the contributions. We take the affiliation from the mail domain declared by the autor, asuming that
gmail.com
are non-affilieted. Given that:
- We can see that the organization that is making the biggest investment on this project is Red Hat, followed by Collabora.
- The majority of the contributions are made anonymously
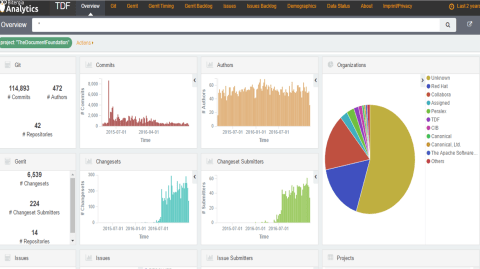
You can see more details of the talk on the deck, or with the video. Or get your own conclusions going deeply in the dashboard.
3. Data Science for Community Managers
Manrique had another talk on Fosdem about data for communities managers.
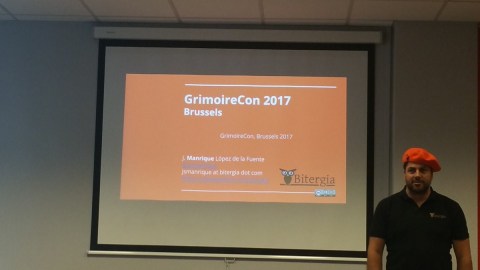
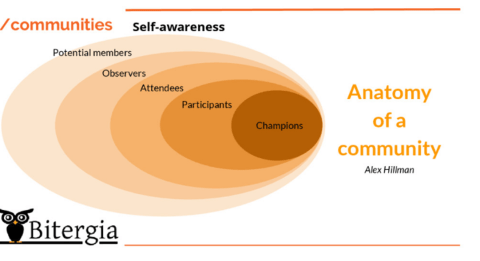
He started his talk reflecting around the concept of community, giving this definition:
“A community is commonly considered[by whom?] a social unit (a group of people) who have something in common, such as norms, values, or identity.” Wikipedia
Manrique described how communities of software are made by people sharing common interestings and how they are organized using several tools like Git, GitHub, Mediawiki or Star Overflow, between others.
Communities are organized around three concepts:
- Self awareness
- Communities have their own structure and every person knows their role.
- Governance
-
Establishment of policies, and continuous monitoring of their proper implementation, by the members of the governing body of an organization. It includes the mechanisms required to balance the powers of the members (with the associated accountability), and their primary duty of enhancing the prosperity and viability of the organization. Business dictionary
- Transparency
- Transparency is the key of the relationships on the community, because it gives the sense of fairness to everyone and for third parties, it gives trust.
Some communities reach the need to have a community manager. Its function is to ensure community health, productivity and visibility.
With that context, data would be a powerful tool for making decisions about efforts or investment, but the bloody truth is that they have no data available and structured because code and collaborations sources are in silos and bring them together is hard.
Grimoire Lab was born just for that, to allow a deep knowledgement of the activity on an open source and inner source project.
Grimoire Lab is a tool to provide a free, open source software platform for:
- Automatic and incremental data gathering from almost any tool (data source) related with contributing to Open Source development (source code management, issue tracking systems, forums, etc.)
- Automatic gathered data enrichment, merging duplicated identities, adding additional information about contributors affiliation, calculation delays, geographical data, etc.
- Data visualization, allowing filtering by time range, project, repository, contributor, etc.
Some of the features that Grimoire provides are:
- Graphical drill down
- Time frame selection
- Easy sharing/embedding
- Data export
- Query API (Elasticsearch)
- Custom widgets and panels creation
- Easy data validation
- Link to real artifacts
- Search box
Moreover, you can get some extra metrics using Grimoire Labs, like:
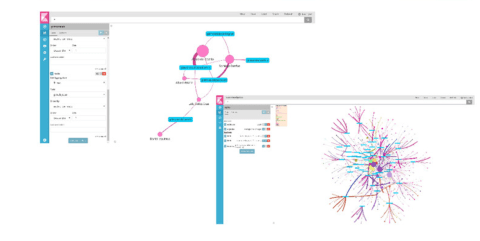
- Network.
- Dependency, as a way of knowing who your project depends on, analyzing:
- Onion model
- ASF Pony Factor
- Bitergia Elephant factor
- Bitergia Zapata factor
- United Fruit Company factor
We’ll write another post telling you what are those variables.
- Geo-analysis based even in time zones to determine the location of the contributions.
- Gender diversity
- Community demography
- Code Review process analytics
- Issues and backlog analytics
- Contributors funnel
Manrique finished his talk, presenting the beta version of Cauldron, a tool to analyze activity in GitHub organizations.
You can check more details on his deck or with the recording of the session.
Don’t miss the opportunity for measuring your open source project. We have an entire training tutorial where you can start to learn how to know better your community.
4. Grimoire Lab: a Python toolkit for software development analytics
The talk explained how to analyze software development repositories of common use in the free software community with GrimoireLab tools, a toolset for software development analytics writing in Python. The talk started by explaining how to retrieve data from git, Bugzilla, GitHub, mailing lists, StackOverflow, Gerrit, and many other repositories, and organizing them in a database.
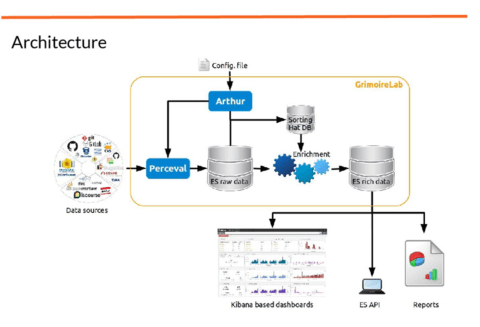
The architecture of Grimoire is quite simple from the point of view of the data flow:
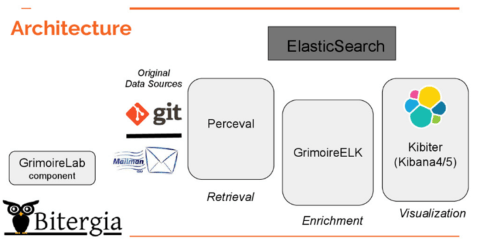
Usually, data flow starts in the code repositories (git, mailing lists, GitHub). Perceval goes to them and extracts data that you can upload to, for example, Elasticseach (generating a raw index). Perceval is totally database agnostic; it only takes the data and produces a set of JSON files.
Then, for producing valuable indexes, we use GrimoireELK; Grimoire ELK goes to raw index and enrich this information doing things like calculating how long did it take to close a ticket. With that information we produce again another ElasticSearch index that we call enriched indexes . Those indexes are designed to be used with Kibana for visualizations. Our version of Kibana is called Kibiter.
Apart of that we have Sorting Hat for identities enrichment; it can do things like affiliations for people or check if two mail address belong to the same person.
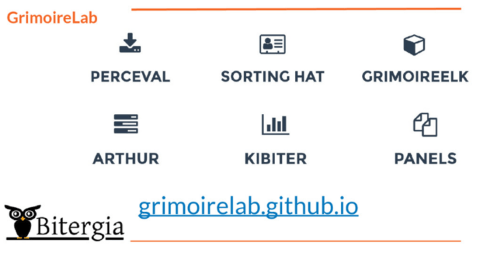
Jesús continued his talk going to practical exercises that you can find on the session recording. You can check his presentation too and of course the more detailed tutorial.
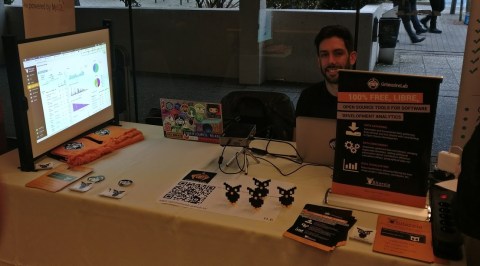
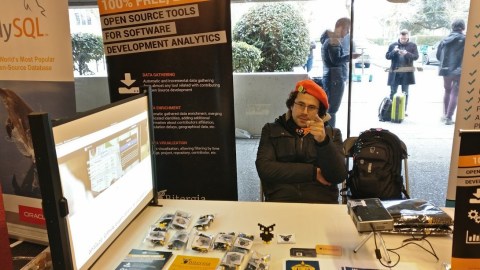
Our booth to meet friends
Besides the talks we meet friends and community at our boot. And give away some presents!

It was our pleasure to have the chance to share tips and trick with developers.
See you next year!
