In a large free, open source software development community, not all developers are equal. Some are more experienced, some are better known, some know better how to adhere to the uses and customs of the project, some write code that is more easily accepted by others. One of the areas where these differences are more noticeable is the code review process. It is not equally easy for all developers to push their patches through code review. Even when the process itself tries to be fair and unbiased, well, “all developers are equal, but some are more equal than others”.
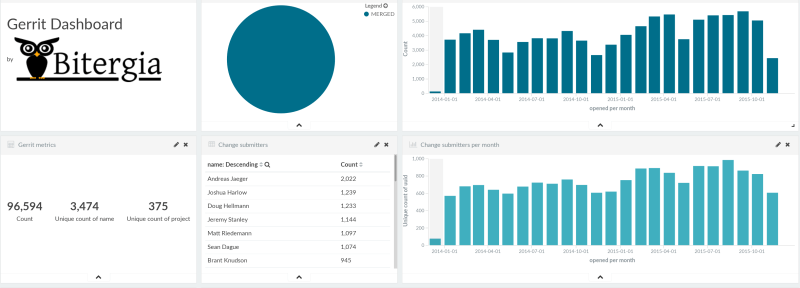
Fortunately, we have plenty of data in the code review system. We can use analytics on that data to learn about how difficult it is for developers to get their patches accepted. We will use a OpenStack code review dashboard, composed with data from the OpenStack Gerrit instance to illustrate the process.
OpenStack uses pre-merge code review. When developers propose a change to the code (a “patchset”), they start a new code review process in Gerrit. During code review, peer developers review the patchset, and either accept it or ask for a new version (a new patchset). This is done until the change is finally abandoned, or merged in the main code base (accepted). During all this process, automatic verification (such as unit and integration tests) are run as well. But in this simple approach we will ignore all that.
Let’s start by defining a couple of parameters to characterize how long does it take until a change proposal is accepted (until the corresponding review process is done). We have chosen:
- Number of patchsets per review process. This is the number of versions of the change that are requested by reviewers. It is a proxy for the effort needed to convert the original change proposal into something that reviewers accept.
- Time until merge per review process. This is a very direct proxy of how long a change is delayed due to code review: for how long the review process is open, since the moment a patchset is proposed, to the moment a version of it is merged.
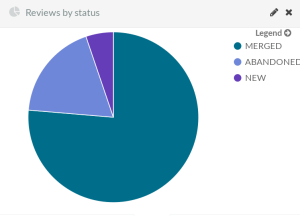
We’re interested in these metrics only for already merged (accepted) review processes. For that, in the dashboard, find the pie showing “Reviews by status”, and click on the “Merged” sector. The whole dashboard will reconfigure showing data only for merged reviews. We will select as well only those reviews starting during the last two years (see the selector in the top right corner of the dashboard), to avoid early stages of the project.
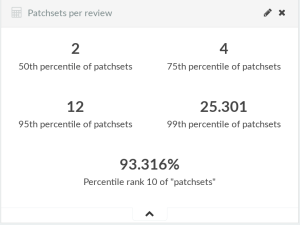
We start by characterizing the whole OpenStack project, using percentiles. The numbers above show that 50% of all reviews (50th percentile, or median) in OpenStack require 2 or less patchsets. If we consider 75% of all reviews, they require 4 or less patchsets. The numbers increase significantly if we consider 95% of reviews, meaning that although many of the reviews require very few patchsets, some require much more. The percentil rank for 10 patchsets (percentage of reviews requiring 10 patchsets or less) is relevant as well: for the whole OpenStack project, 93% of the reviews are in this category (that is, they required 10 or less patchsets until merge).
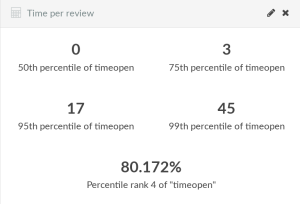
The same can be done for the time spent per review (time open, or time to merge, per review). The numbers in the chart above are rounded down to days. In it we can see how 50% of the reviews are merged in less than one day. 75% of them in less than four days. But there are some long reviews as well: 5% of reviews take more than 18 days to finish. If we state a goal, such as “less than 5 days”, we can see how about 80% of reviews match it.
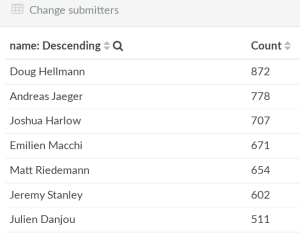
Once we know about the general metrics for OpenStack, we can compare with those of specific developers, to see how they perform in comparison. For example, take Doug Hellman, one of the developers proposing more changes during the last year. Just click on his name in the “Change submitters” table, and the whole dashboard will show his numbers.

We can start by watching his contributions (change proposals submitted by him that eventually became merged) over time. This will later allow us to check his stats during periods of different activity levels, but also to realize that he maintains a sizable activity during all the past year.
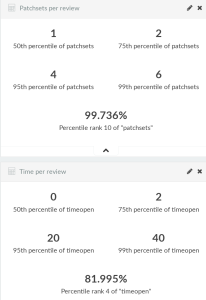
His numbers are remarkable. 99% (that is, almost all) his change proposals were merged after 6 or less patchsets, and 95% of them required less than 5 (compared to 13 for the whole OpenStack). This means he is proposing changes that reviewers find easy to accept, and that he knows how to address the comments by them. Time-to-merge for his proposed changes are also good: 75% of them are merged in less than 3 days (compared to 4 days for the whole project). However, the numbers for the longest review processes are not that good: 5% of them took more than 20 days to complete, compared to 17 days for the whole OpenStack.

The evolution of time-to-merge over time shows more details on his performance. Most of the time, his changes are well below 20 days to merge (for 99% of those). Only during some months those numbers increase. Crossing those months with the activity level that we saw some charts above, there is some explanation for higher numbers during some months in a higher activity (consider for example September 2015).
But there is much more to dig. Not all OpenStack subprojects are equal. We can check in which ones this developer was contributing, to have a fairer view of the numbers in those (since some subprojects tend to code review faster than others).
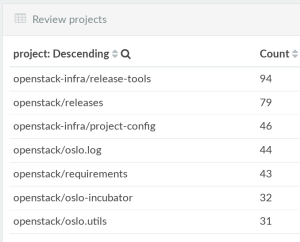
Since his top project (by number of changes proposed and merged) is openstack-infra/release-tools, lets filter his activity in it. Let’s just click on that project in the table, and a new green filter will appear in the top left of the dashboard, and it will reconfigure again to show only activity by Doug Hellmann in openstack-infra/release-tools.
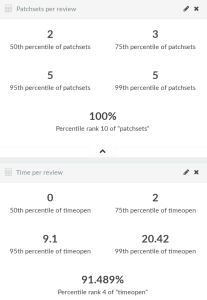
His numbers for this project are quite similar. For time-to-merge, they are even better than when we consider all his activity. But what will happen when we compare with the numbers for openstack-infra/release-tools? Let’s go to the top right of the dashboard, with all those green filters, and let’s click on the trash can in the “Doug Hellmann” filter. That will remove it, causing the dashboard to show now all the activity for openstack-infra/release-tools. Let’s compare.
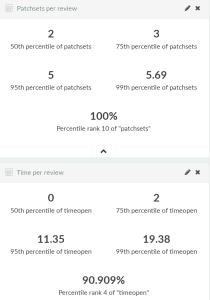
The general numbers for this subproject are quite similar to the numbers of the developer we were analyzing. So, at least in this project, we can consider his activity as “regular”, and therefore his good numbers (again, for this subproject) are the norm.
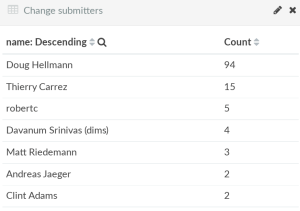
Drilling down a bit more, we can explore which ones are the developers proposing changes in that subproject, and we learn that most of the activity is by Doug Hellmann himself. Which means that when we’re considering the numbers for the whole subproject, we’re very much measuring his personal activity. Hence, now the coincidence in the numbers has a clear cause.
We can go on further, analyzing other developers, or even all developers from a certain company or a certain level of activity, in all the project or only in certain subprojects, during specific periods of time. Even we can explore the evolution of these metrics over time. And with each of this actions, we will learn more and more.
In summary, having the right numbers, we can spot those developers who are overperforming and underperforming. Those that need less patchsets to make a change get merged. Those with shorter time-to-merge for their reviews. And we can find out how good or bad their numbers are in the context of their activity, and the areas of the project in which they work. We can tell those developers who are “more equal” than others, but we can also track developers who are improving, or developers who may deserve some help, or find good practices that could be exposed to all developers to improve overall performance.
Of course, not all code reviews are equal, and the two metrics that we have selected provide only a partial view of what is happening. But all in all, this view can be good enough for getting a lot of knowledge about how proposed changes are being converted into merged commits after the code review process.
Final note: The data used in this discussion is probably correct, but it is subject to bugs in the tools used to retrieve it from Gerrit, and in the dashboard itself. So please consider it as an illustration of how to track code review, and not as an specific case of analysis of a certain project or developer.


