Whether you struggle to understand which open source technology your software team should put its effort into, which open source projects are sustainable in the long term, or where is your development team contributing to, Cauldron.io can help you!
Cauldron.io allows IT project managers, analysts, and developers to understand more about the community and processes involved in software development. This 100% MaaS open source tool offers different ways to establish software development analysis strategies for different business goals. Here we list 3 things you can do with Cauldron that you never thought about to maximize your cauldron data analysis.
Measure covid-19 impact
The COVID-19 outbreak is one of many events that have made 2020 a year like no other. We can see if COVID-19 positively or negatively affected open source projects by comparing the 2020 quarantine period with the same time period from the year before. Some of the topics Cauldron’s predefined dashboards cover that can be useful to understand COVID impact include:
- Community activity: activity patterns over time around commits, issues, and pull requests.
- Talent management: number of active people creating issues, committing code, or merging pull requests.
- Performance: time to open/ close issues and review code.
You can also import your own disruption analysis dashboard in the data workspace of Cauldron. This will get further information like active commit authors by email domain, active commit authors by time zone, and more.
Analyze GNOME & KDE GitLab Projects
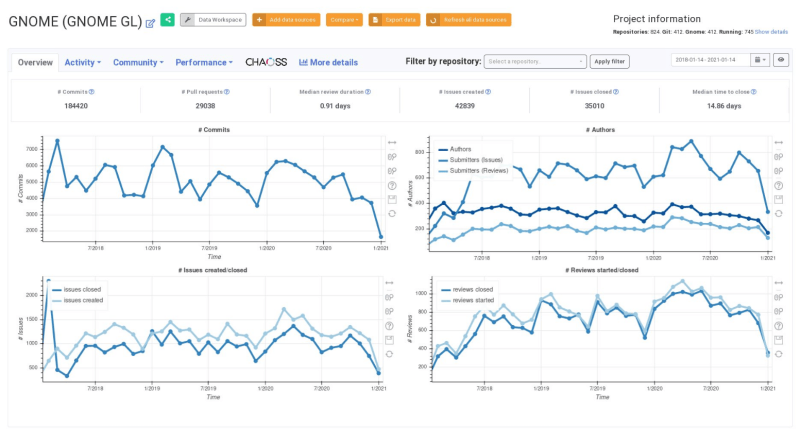
Since the latest release of Cauldron, now you can analyze GNOME and KDE projects hosted on GNOME’s/KDE custom GitLab instance. Remember that in order to carry out the analysis of these repositories you will need a GNOME account / KDE account.
Thanks to this new feature, we can see, for instance, development data about all GNOME org repos:

Analyze Open Source Ecosystems
In a previous post, we talked about the importance of Open Source ecosystems for Intelligent Open Source. Open Source Ecosystems are the different OSS projects a company releases, contributes or uses.
What can be measured to analyze specific open source ecosystems with cauldron?. These are some of the insights:
Shape of the ecosystem
This topic is related with complexity, activity diversity and responsiveness.
Complexity:
The number of code repositories and people involved. An increasing number of repositories might indicate an increasing complexity of the analyzed ecosystem.
Activity diversity:
Total number of commits, issues, patches requests, and lines of code added/removed over a period of time. When and where the activity occurs indicates how it is distributed in the analyzed ecosystem.
Responsiveness:
Time to solve issues and pull requests or merge requests, as well as average commits per day.A lower average response time indicates a higher performance in the analyzed ecosystem.
Talent management
This part answers the question “How is talent managed within an Open Source Ecosystem?” There are two topics that we can get from cauldron dashboards:
Contributors Growth:
We can identify the contributor retention rate (contributors remaining engaged) and bounce rate (contributors leaving).
Sustainability risk:
Although there are many ways to identify whether or not a project is sustainable, the bus factor seems to be a very powerful indicator that has helped many other companies in the past.
The bus factor is the minimum number of team members that have to suddenly disappear from a project before a project stalls due to lack of knowledgeable or competent contributors. A low bus factor can be a sustainability risk.
we can analyze the minimum number of contributors needed to make 50% of total code contributions.
Community footprint
This part answers the question “What’s the presence and influence of organizations within the open source ecosystem?” There are three topics to analyze:
Organizational share:
A good indicator can be using the Gamma factor. The gamma factor is the amount of code contributors using Gmail accounts for their commits, and the ratio of commits done by them. The bigger the number, the higher probability the OSS ecosystem is a non-company driven project.
Community affiliation:
A good indicator can be using the Elephant factor.The elephant factor is the minimum number of organizations whose employees perform 50% of the total contributions.
Note: Cauldron takes privacy seriously, that’s why we don’t store any email. This means we can safely use “email domains” as an approach to Elephant Factor following GDPR rules. However, by requesting Bitergia Analytics or Cauldron Cloud organization data is possible to get, always being GDPR compliant.
Time management:
Activity during regular work hours may come from contributors who are paid by their job to participate. Activity after hours or on weekends may come from unpaid volunteer contributors. Distribution of paid and unpaid contributions may work as indicative of developer burnout. This can be seen by analyzing contribution patterns heatmap.
Set up your Cauldron Cloud today
Cauldron is the tool you need to understand the community and the processes involved in software development, which will help you establish the right strategies to achieve your business goals.
You can access our early adopters offer, and start reporting today!


