Bitergia is happy to congratulate the CHAOSS community to its second metrics release. The five working groups of the CHAOSS community defined 39 metrics across 16 focus areas where more than 300 people contributed to the metric definitions.
Let me tell you a story. Once upon a time, an owl asked Bitergia what metrics to use for understanding the software development projects that mattered to them. Every day, the owl would login to the metrics dashboard that Bitergia had provided and try out a different visualization and try to make sense of the data. Then one day, Bitergia with friends from industry, academia, and the Linux Foundation started the CHAOSS (i.e., Community Health Analytics Open Source Software) project to define what metrics existed and how they can be understood. Today, the owl relies on the metrics and visualizations that have been vetted, tested, and standardized by the CHAOSS community, regularly impressing its boss. The owl lived happily ever after and never worried about finding the right metrics again.
This story shows the future we are building with CHAOSS. Born out of the need to serve customers better, Bitergia was a founding member of the CHAOSS project and donated its open source GrimoireLab toolset to the new project. Bitergia continues to employ the maintainers and core developers of the GrimoireLab toolset because it is critical to its business and service offerings.
As the company most vested in the GrimoireLab toolset, Bitergia is proud to support most of the CHAOSS metrics. Bitergia customers already have access through their dashboards. At the bottom of this blog post is a table that shows which metrics are supported by our tool.
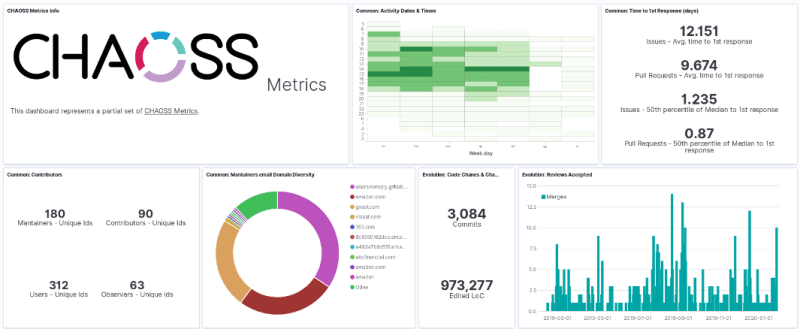
The new Bitergia Cauldrio.io platform also supports many of the CHAOSS metrics. Bitergia CEO, Manrique, built a CHAOSS metrics dashboard that any user of Cauldron.io can import and use immediately. The beauty of cauldron.io is that it requires no setup, no installation, and is ready to show metrics with just “one-click” (if you don’t consider the steps required to import the CHAOSS metrics dashboard). For a detailed description on how you can get started with Cauldron.io, see the documentation. See the tweet that shows the metrics from Cauldron.io:
Do you know that software development analytics dashboards created within @cauldronio can be reused or shared with the community to reuse, learn, modify, and even redistribute those modifications? Learn how in our community forum: https://t.co/3VfwNbXDk2 pic.twitter.com/NzW3YtdibZ
— Manrique 🖖🤙 (@jsmanrique) February 1, 2020
GrimoireLab supported CHAOSS metrics
List of CHAOSS metrics supported in GrimoireLab and therefore available to Bitergia Analytics customers and Cauldron.io users.
| Common Metrics | |
| Focus Area – When: Time | |
| Activity Dates and Times | What are the dates and timestamps of when contributor activities occur? |
| Time to First Response | How much time passes between when an activity requiring attention is created and the first response? |
| Focus Area – Who: People | |
| Contributors | Who are the contributors to a project? |
| Organizational Diversity | What is the organizational diversity of contributions? |
| Evolution Metrics | |
| Focus Area – Code Development Activity | |
| Code Changes | What changes were made to the source code during a specified period? |
| Code Changes Lines | What is the sum of the number of lines touched (lines added plus lines removed) in all changes to the source code during a certain period? |
| Focus Area – Code Development Efficiency | |
| Reviews Accepted | How many accepted reviews are present in a code change? |
| Reviews Declined | What reviews of code changes ended up declining the change during a certain period? |
| Reviews Duration | What is the duration of time between the moment a code review starts and moment it is accepted? |
| Focus Area – Code Development Process Quality | |
| Reviews | What new review requests for changes to the source code occurred during a certain period? |
| Focus Area – Issue Resolution | |
| Issues New | What are the number of new issues created during a certain period? |
| Issues Active | What is the count of issues that showed activity during a certain period? |
| Issues Closed | What is the count of issues that were closed during a certain period? |
| Issue Age | What is the average time that open issues have been open? |
| Issue Response Time | How much time passes between the opening of an issue and a response in the issue thread from another contributor? |
| Issue Resolution Duration | How long does it take for an issue to be closed? |
| Risk Metrics | |
| Focus Area – Business Risk | |
| Committers | How robust and diverse are the contributors to a community? |
| Elephant Factor | What is the distribution of work in the community? |
What to do next
It’s time to try these metrics your own! As mentioned before, you can apply these metrics in your projects using Cauldron.io (no downloads needed), share your report at Community.cauldron, or even suggest future metrics and contribute to CHAOSS community


