Public quarterly reports are used for understanding the performance of companies. And so, quarterly reports done by Bitergia fill the gap of understanding the performance of open source communities. This type of analysis focuses on those that are still interested in metrics, but do not have the time to play with the dashboards. This indeed provides a full overview of the current quarter, but adds a comparison with the previous quarters. This allows to have some extra context about where the community is heading.
These reports are focused on three main parameters:
- Activity: The activity takes into account the several data sources used by the community and measures and compares to previous quarters some basic metrics such as commits, proposed patchsets in the review process and those that were merged or abandoned, emails sent, threads initiated and others.
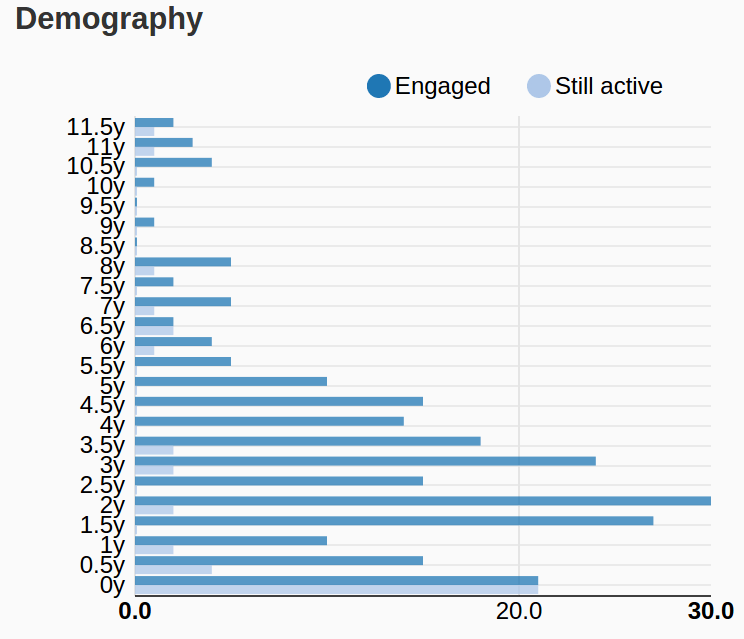
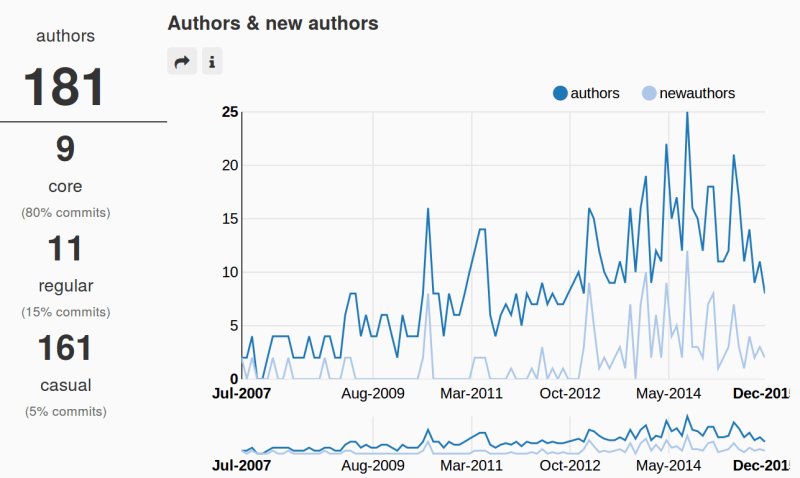
- Community: The community analysis focuses on the structure of the community providing insights about how people and organizations behave and evolve in the project. Some examples about this are the demographics analysis where attracted and retained developers are calculated each semester.

Or the ‘onion model’ of the community with the number of ‘core’, ‘regular’ or ‘casual’ developers that at some point have contributed to the code.

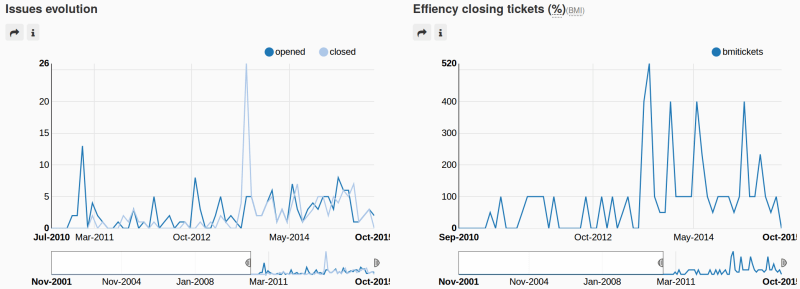
- Process: The process analysis is focused on the efficiency of the community when dealing with issues or code review processes. Its main metrics provide information about the different time to reach some actions and the performance closing those. An action could be the merging of a piece of code or the moment when a reviewer sends her comments about that piece of code. While for the performance study a usual metric in maintenance is used: the BMI (backlog management index) that provides a view about how effective the community is dealing with issues and if those are being closed faster or slower than the issues landing in the project.

On top of this, it is worth mentioning that each community is different and for that, customized reports are needed. Each community has its own idiosyncrasy and this is usually different from others.
As examples for this post, we have brought:
They use similar infrastructure, but the needs of each of them are different. First, the size. Both are not comparable projects in size and community. And second, the history of each of them. The OpenStack community shows a history of at least 5 years while the OPNFV project started to track its activity at the end of 2014.
If you are interested on this kind of reports, contact us for detailed information.


