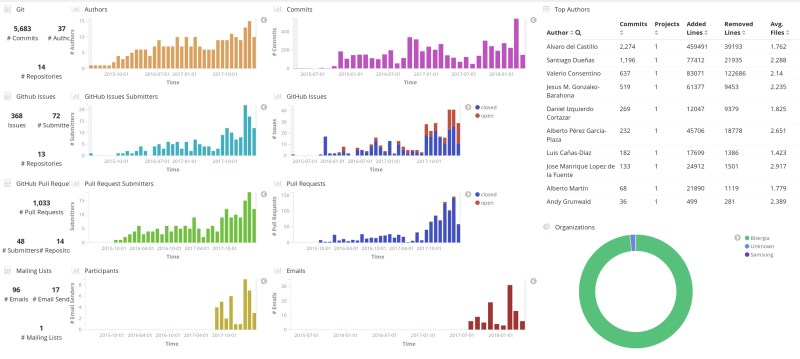
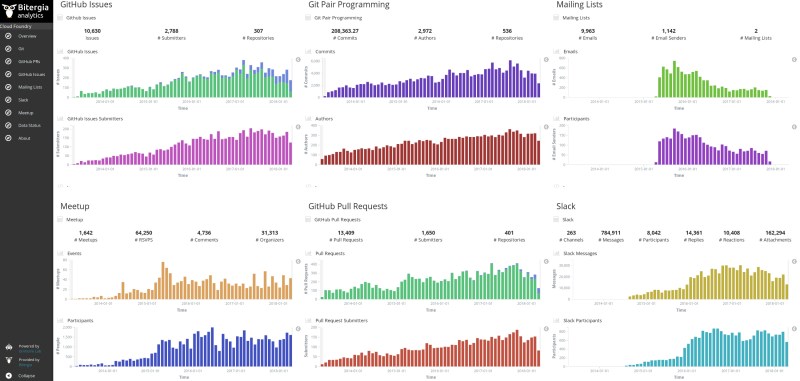
How have we ended with more than 30 different data sources supported in our Bitergia Analytics product? During the last couple of years I’ve been so focused on improving the support and operating areas here in Bitergia that I forgot to stop and look back to see how far we have “walked” in terms of development.
I still remember when we were able to track 5 data sources using the tools we wrote under the umbrella of the Metrics Grimoire Community (one of the ancestors of the CHAOSS GrimoireLab Community).
Today, almost 6 years later, we are supporting more than 30 different data sources with a couple of developments in progress, so we’ll be close to 40 by the end of the year.
For a small team like ours, the decision of adding more and more data sources to GrimoireLab portfolio is not an easy one, and it wouldn’t be possible without the help of GrimoireLab community.

The more connectors you add to your stack, the more likely you will have issues not only with bugs, but with API changes, different service limitations and even different ways of interpreting the data you get from them.
Why we did it?
The answer is easy, we want to offer the most complete view of a project in terms of processes, activity and community. Have we achieved that? To be honest, this is something our customers should answer.
The effort of these years trying to offer that holistic view for software projects can be seen below in the list of data sources currently supported:
- Code:
- Tickets/Issues
- Code Review:
- Gerrit
- GitHub
- Containers/Packaging:
- Continuous Integration:
- Wiki:
- Question & Answer Forums:
- Askbot
- Discourse
- Stack Exchange (the platform behind Stack Overflow)
- Mailing Lists:
- GNU Mailman flavors like Pipermail and Hyperkitty
- Mbox format files
- NNTP
- Chats:
- Meetings/Events
- Meetup
- Mozilla Reps meetings
- Social Networks:
- Others:
- RSS
- Web Server logs
Having such a long list of data sources supported is not enough and we know it, and we want to make easier for you to set up your own analysis for free with these ones and test the results.
And since everything is 100% based on free, open source software, feel free to report issues or help the community giving support for the still partially covered data sources like Launchpad, or the upcoming ones…
What’s next?
The next generation of dashboards shall start breaking the metric silos we have for each data source and start aggregating information using all of them to offer, for example, support for the CHAOSS Metrics categories: Diversity-Inclusion, Growth-Maturity-Decline, Risk, and Value.
It is an awkward feeling when you know you are close to get something with a great added value but you still have to walk a couple more miles before reaching that point. In any case if you are in a similar scenario, my only recommendation is to enjoy your way, whatever it is and wherever it leads you.
And of course, more data sources are coming! Check existing GrimoireLab open issues and tell us which ones do you miss?


