Nowadays, more and more companies such as PayPal, Bosch or Autodesk are internally implementing inner source programs. InnerSource differs from classic open source development process by remaining within the view and control of a single organization and offers many advantages in terms of efficiency and effectiveness.
In previous posts, we talked about InnerSource characteristics and advantages such as InnerSourcing: the development model of the future.
Today, we will focus more on how to measure your InnerSource projects and some effective metrics that will help us to drive our initiative.
Applying open source models within companies needs an in-deep study at three areas: culture, process and tools. During the whole inner source strategy process, it is important to make sure everything is properly working. And for this, metrics are priceless. Thus, being able to measure collaboration or productivity takes an important role in our overall strategy. It is then, quite common having questions like:
- How do I know if my InnerSource initiative is actually working? What are the first steps?
- What are the measurements I should take into account when starting with inner source? How can I measure success?
- Is it possible to measure collaboration? Can I aggregate information from the several pieces of my infrastructure?
- Is it possible to measure performance? How can I check if the InnerSource promises are actually working?
Measuring collaboration
We will focus now on how to measure collaboration within inner source projects. One of the most useful metrics that will help us on this task is measuring business units collaboration, that can be companies, organizations or teams.
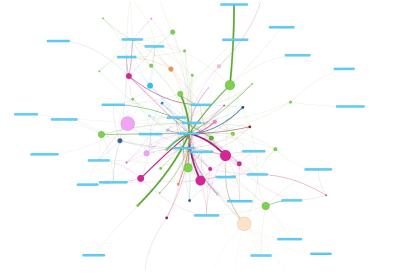
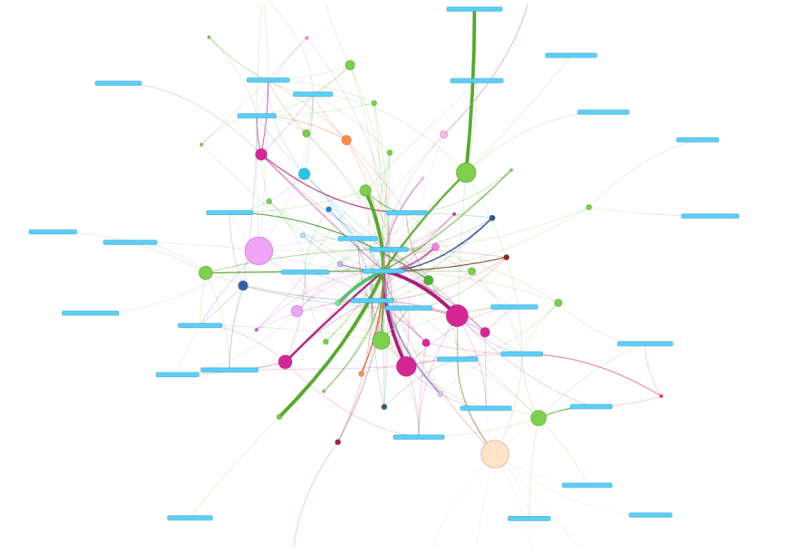
The image below shows a network chart where each circle determines the amount of repositories contributed to by a developer, while the thicker the edge, the more contributions done to the same repository. The blue rectangles are each of the contributed repositories. And each of the colors represents each of the existing business units. Thus, from a visual perspective, we can see how the pink and green business units are contributing to the same repository (one of the rectangles in the middle) with certain activity (thick edges) and working at the same time in other repositories (size of each of the dots).
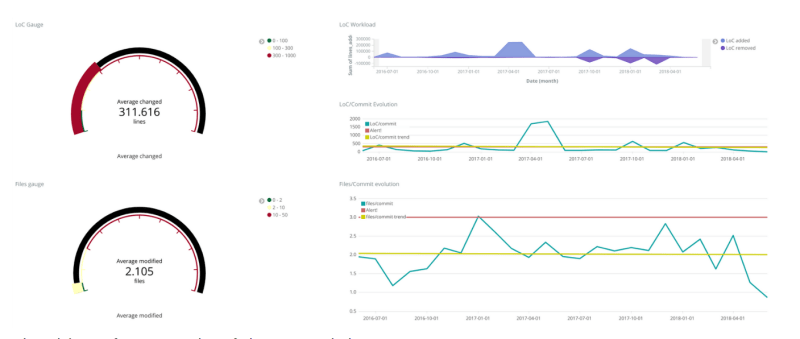
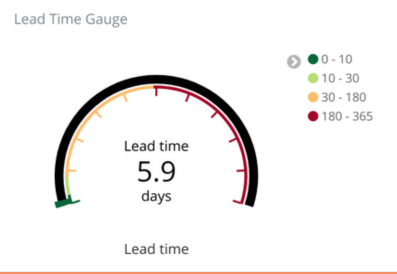
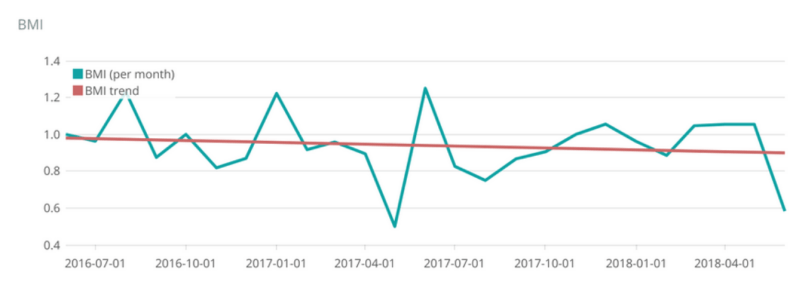
In addition to this, there are other visualizations and you can customize your own Inner source analytics dashboard with different metrics. The following figure shows, for instance, the Git activity performance and the size of alerts and changes within an inner source project.
Last but not least, Bitergia is an active member of InnerSource Commons and part of the CHAOSS project, held by the Linux foundation. Supporting more than 30 data sources, our Bitergia team has the expertise to measure Inner source projects. If you are considering investing in Inner Source, we have free, open source software tools to do it and we will be very happy to help.

