We have some exciting news! The Analytics Dashboards are being upgraded to our latest Kibiter release based on Kibana 6.1.0. This new version will allow our customers to enjoy new visualizations, new metrics and a new security layer. Everything 100% open source software.
New visualizations available
We have added some new visualizations which are not available within the standard version of Kibana. So four new ways to give shape to your data!
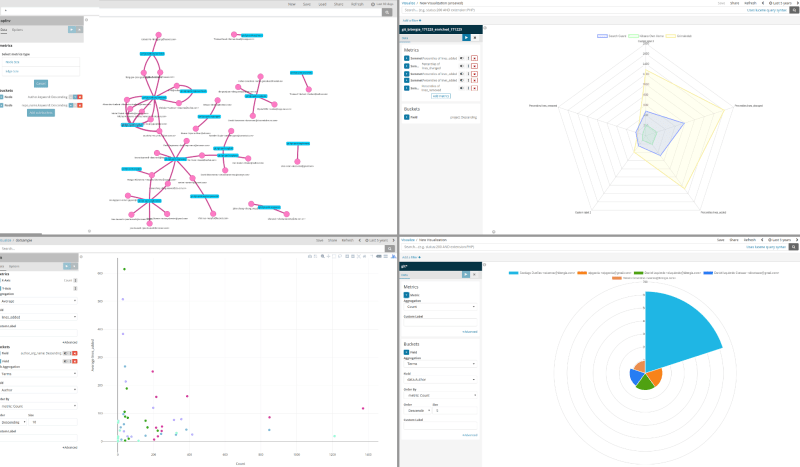
- Network visualization (top-left corner in the image below) to build nice customized graphs to measure collaboration among developers or even different business units.
- Radar visualization (top-right): a great way to measure performance with a visual comparison of your data.
- Dot Plot visualization (bottom-left): to see how your data is distributed represented by dots.
- Polar visualization (bottom-right): a different type of scale comparison based on circular-segment areas.

New metrics are on its way
This new version includes new panels with deeper metrics based on software development research: Areas of Code and Onion Analysis.
Areas of Code analysis panel will help to identify the knowledge area covered by each of the contributors to any repository and any project in your organization: You will be able to drill down at the level of file or look for specific folders of your interest to obtain those contributors and their organizations that are actively participating.
Onion analysis panel allows to analyze community structure relying on the Onion model at different levels of granularity (Globally, by organization, by project and by quarter) dividing contributors into three main groups: core (80% of the activity), regular (15%) and casual (5%).
SearchGuard: new security control
We have improved the secured access to the dashboard using SearchGuard, an open-source security plug-in for ElasticSearch and Kibana as an alternative to X-Pack (the proprietary solution for security provided by Elastic) following Bitergia’s commitment with free, open source software.
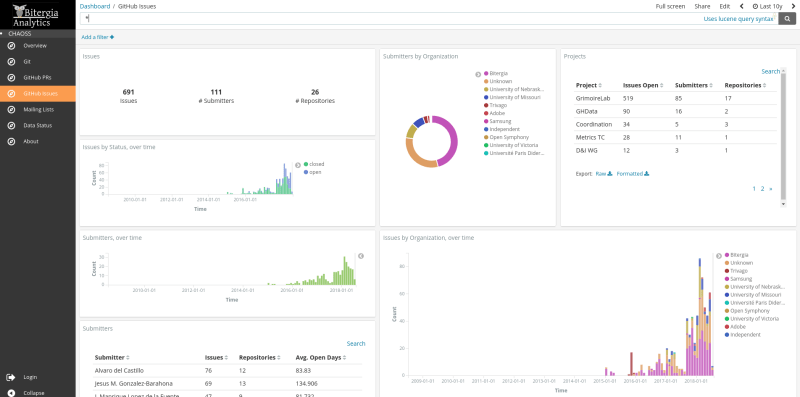
With some modifications we have included a Login screen to access the editable version of your dashboard, so if you have activated both public and private access to your dashboard you will see a nice login button at the bottom of the menu bar on the left.
This useful security layer will allow us to produce different access roles so scenarios such as having both public and private data will be possible.
Redesigned UI
You will see a redesigned user interface: Kibiter UI has been updated with new styles, including a color palette swap to improve accessibility. We have also redesigned the panels, adapting them to the new UI.
Last but not least…
Are you attending to OSCON this year? If so, we are organizing a workshop near the location where OSCON is celebrated , where you can learn about these new panels and visualizations! To get your FREE ticket, leave us a message at info@bitergia.com . And remember, if you have questions about software development analytics just ask!


