At Bitergia, we’re always committed to our beloved customers, always trying to offer the best of our work and to help to level up their software development analytics. Thus, this blog post wanted to summarize the general satisfaction with Bitergia Analytics tool, the usage, facilities, and the relationship working with us.
The following results have been based on a survey sent to all our customers in the last quarter of the year. All the percentages shown in the document are calculated based on the received surveys.
Usage of Bitergia Analytics Platform
To the question “How often do you use the dashboard?” the answers were distributed in
- 12,5 % of our customers use the dashboard at least once per quarter.
- 50 % of our customers use the dashboard at least once per month.
- 37,5 % of our customers use the dashboard at least once per week.
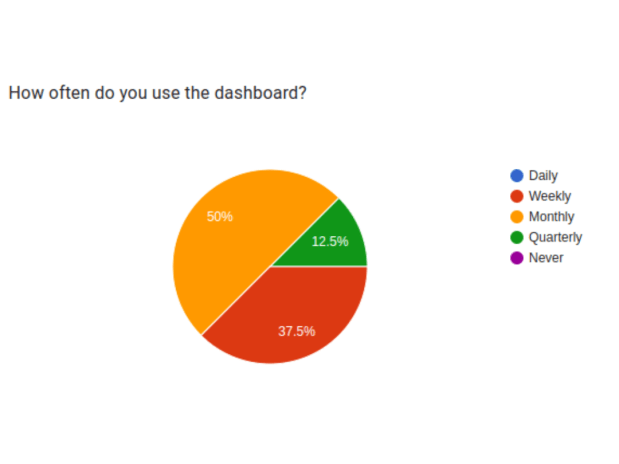
The dashboard is used at least once per month for the big majority, which means that the tool helps create monthly reports that help the decision-making; you can find several examples in the use cases we prepared with some customers. Take a look at our Resources page!
Performance of Bitergia Analytics Platform
For this section, we wanted to measure the services around the platform, like the Support service from Bitergians, Documents related to pieces of training and how to use the tool, and the general User Experience around the tool, and the results we got were:
- 60% of customers were satisfied, 10 % were more than satisfied, and 10 % were delighted with the Support service.
- 40 % of customers were satisfied, 20% were more than satisfied, and 10% very satisfied with the Docs and Training.
- 40 % of customers were satisfied, and 20% were more satisfied with the User Experience.
We’re thankful for the good results we received with our Support Service; nevertheless, it can be improved to cover all the needs you need. This year we implemented a new Support Platform, and during the last months, it evolved and got a better response, so we’re optimistic that next year you can reach new levels of satisfaction.
Some comments we received about the tool mentioned “complicated” and “complex.” We understand that the User Experience needs to be improved. From Bitergia, we’re currently working on improving the Experience with (examples)
It is essential to have good Documentation and Training with a complete guide about the tool. Some comments mentioned that “it takes time to get familiar with the tool.” We should improve this with better guides, and we’re currently developing a Bitergia Analytics Handbook with a complete guide about how to use the tool from the beginning and also a series of demo videos explaining all the steps easily.
Visualizations and Dashboards
Our customers use the dashboard to make decisions in their organizations; this includes creating dashboards with their data, which also generates their visualizations to measure their data.
Also, they manage their identity, which means it can be known who is contributing, where that person is working, or what companies are contributing. That could show, in some cases, that the main contributors are for certain companies, not necessarily for the principle of the project, which could mean different things: risk for not having the lead, not having motivated contributors in our own company, or other issues.
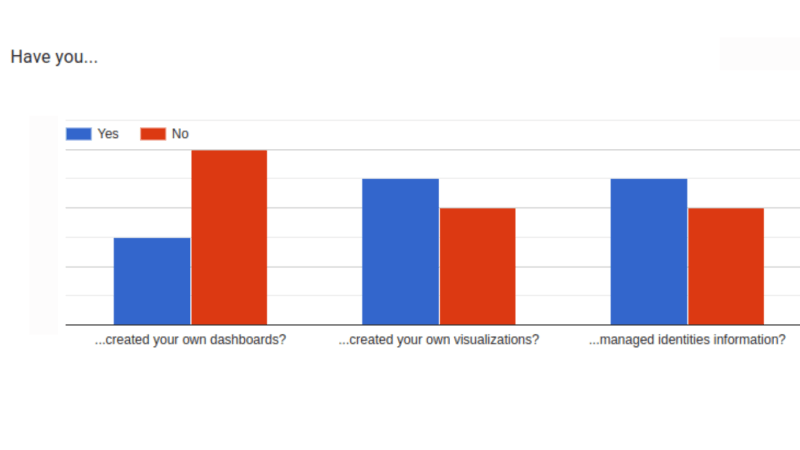
- 50 % of our customers have created their visualization.
- 30 % of our customers have created their dashboards.
- 50 % of our customers have managed identity information.
Some customers say they want to add custom data (“to support some project-specific concepts, configurations, SLAs, etc.”).
A helpful hand for Decision-Making
We know making decisions in an organization can be a challenging task. That’s why we need useful data that shows different metrics that allow making decisions exactly and more accurately.
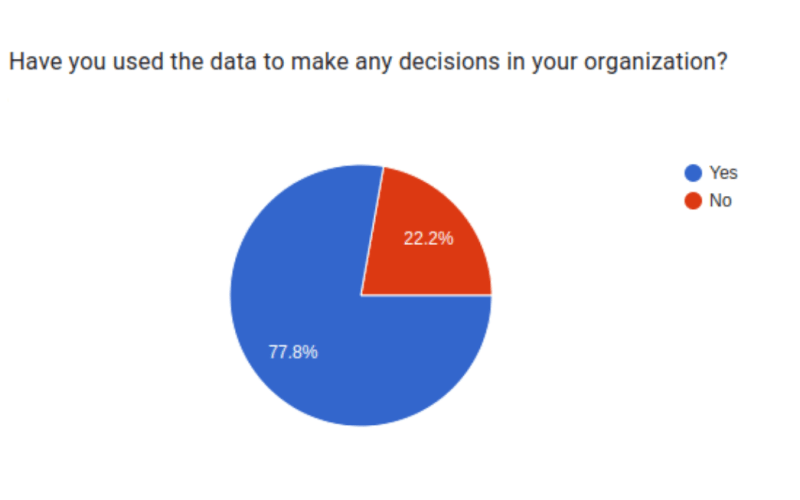
We have a 77,8 % of customers that used the data to decide within their organizations. This shows the fit of the tool to use a decision-making hand. Some examples the tool can help to know are how many new contributors have had your project or who is the main contributor or company of your project.
Consultancy sessions, another helping hand
What is a dashboard tool full of metrics without the human touch? We support the customers with Consultancy sessions to solve customer questions about the data and customization of the platform and to work with the customer in advance of a metrics strategy. And we wanted to know how we perform in the Consultancy service:

100% of the customers are providing a high score for Consultancy sessions. 33,3 % gave the highest score. We’re very thankful, and we can proudly say we offer a complete Consultancy service around Bitergia Analytics Platform.
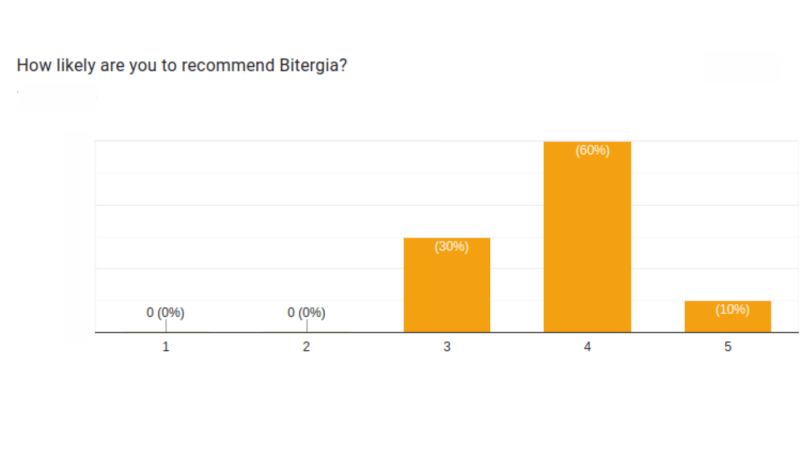
How likely are you to recommend Bitergia?
The question we all want to know is, will you recommend Bitergia to others? We don’t want to brag, but 70 % of our customers would recommend Bitergia more likely. This is possible thanks to the hard work of our beloved Bitergians!
We are grateful to everyone who helped to make this survey possible, especially the survey respondents. Your participation and collaboration help us to grow and advance our shared knowledge.
Do you want to share something else with us? Contact us now or schedule a meeting with your account manager, and we can help you with anything you need!
Latest Posts
- Organizing CHAOSScon Africa: Insights, Talks, and Key Takeaways
- Diversity, Equity, and Inclusion in Open Source: My Journey and Contributions at Bitergia
- Project Awareness and Popularity: Essential Metrics for Open Source Projects
- Unveiling the Key to Open Source Success: Measuring Project Health
- Lead Time Metric for Issues and Code Changes


